Fish

ACL methods

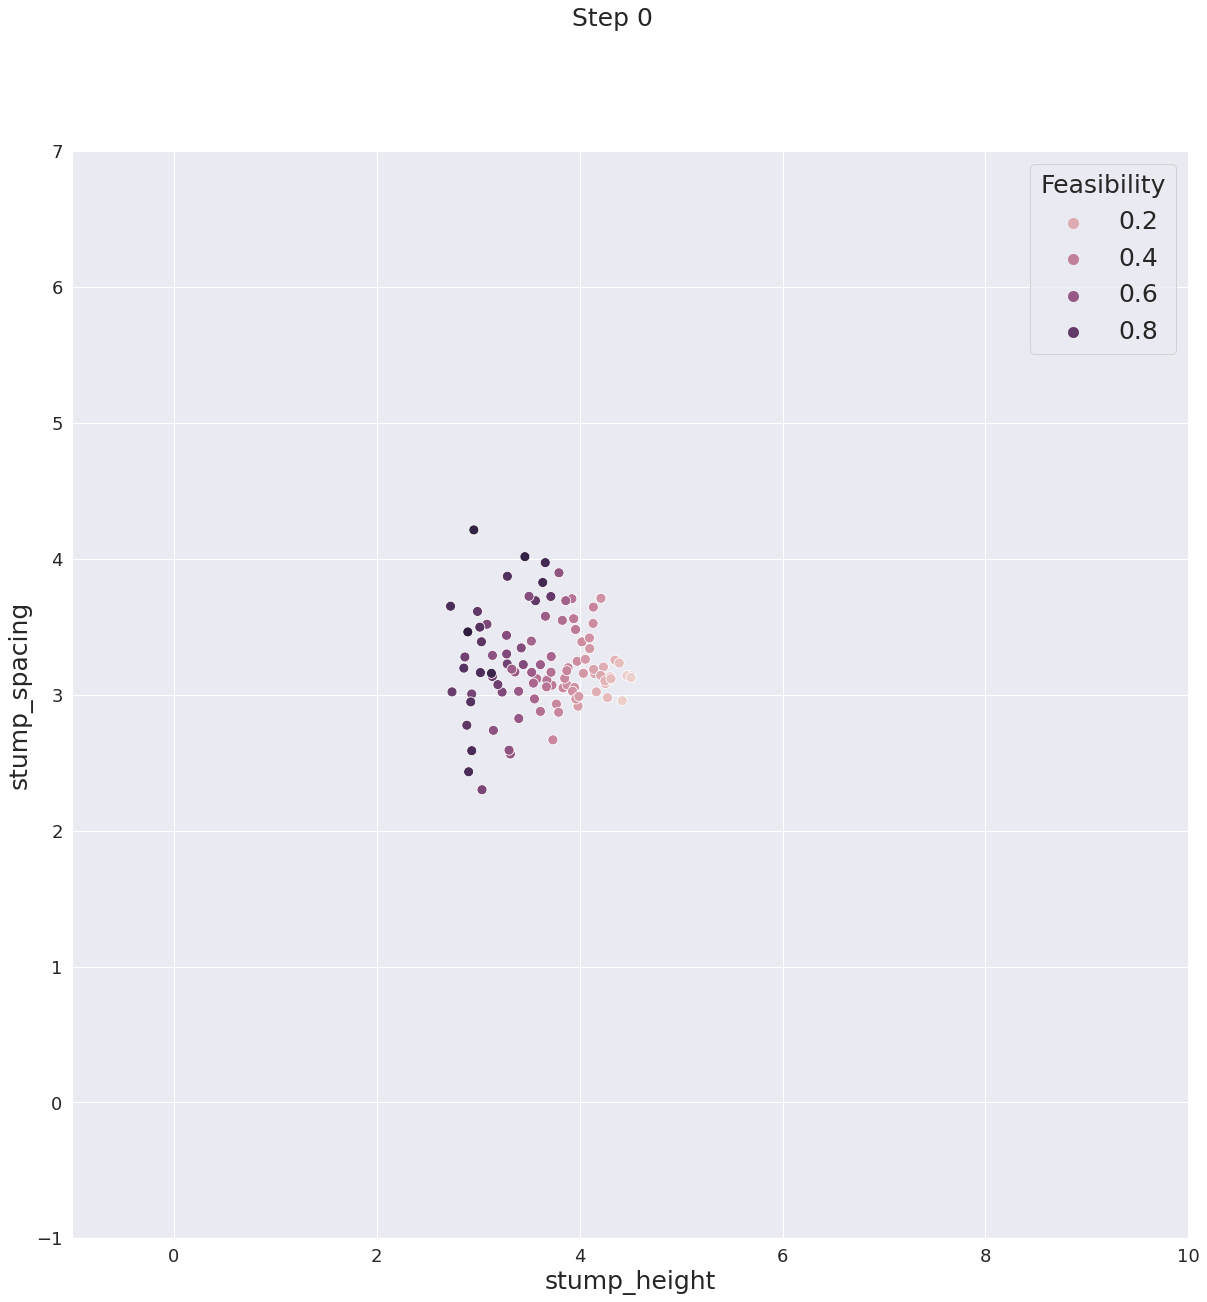
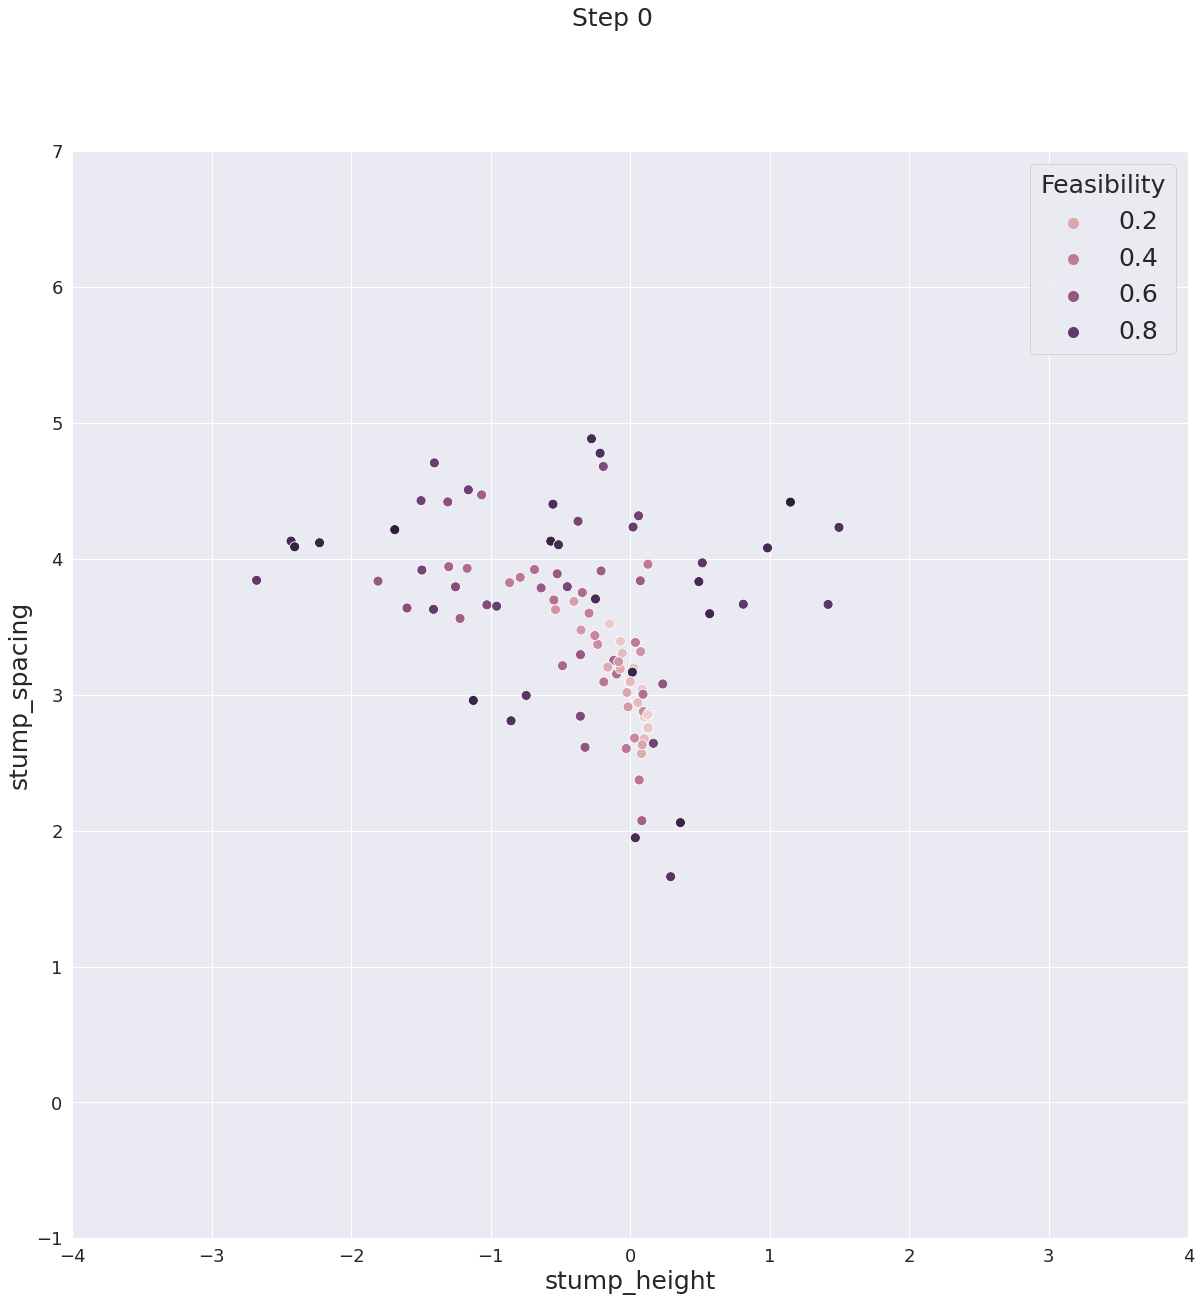
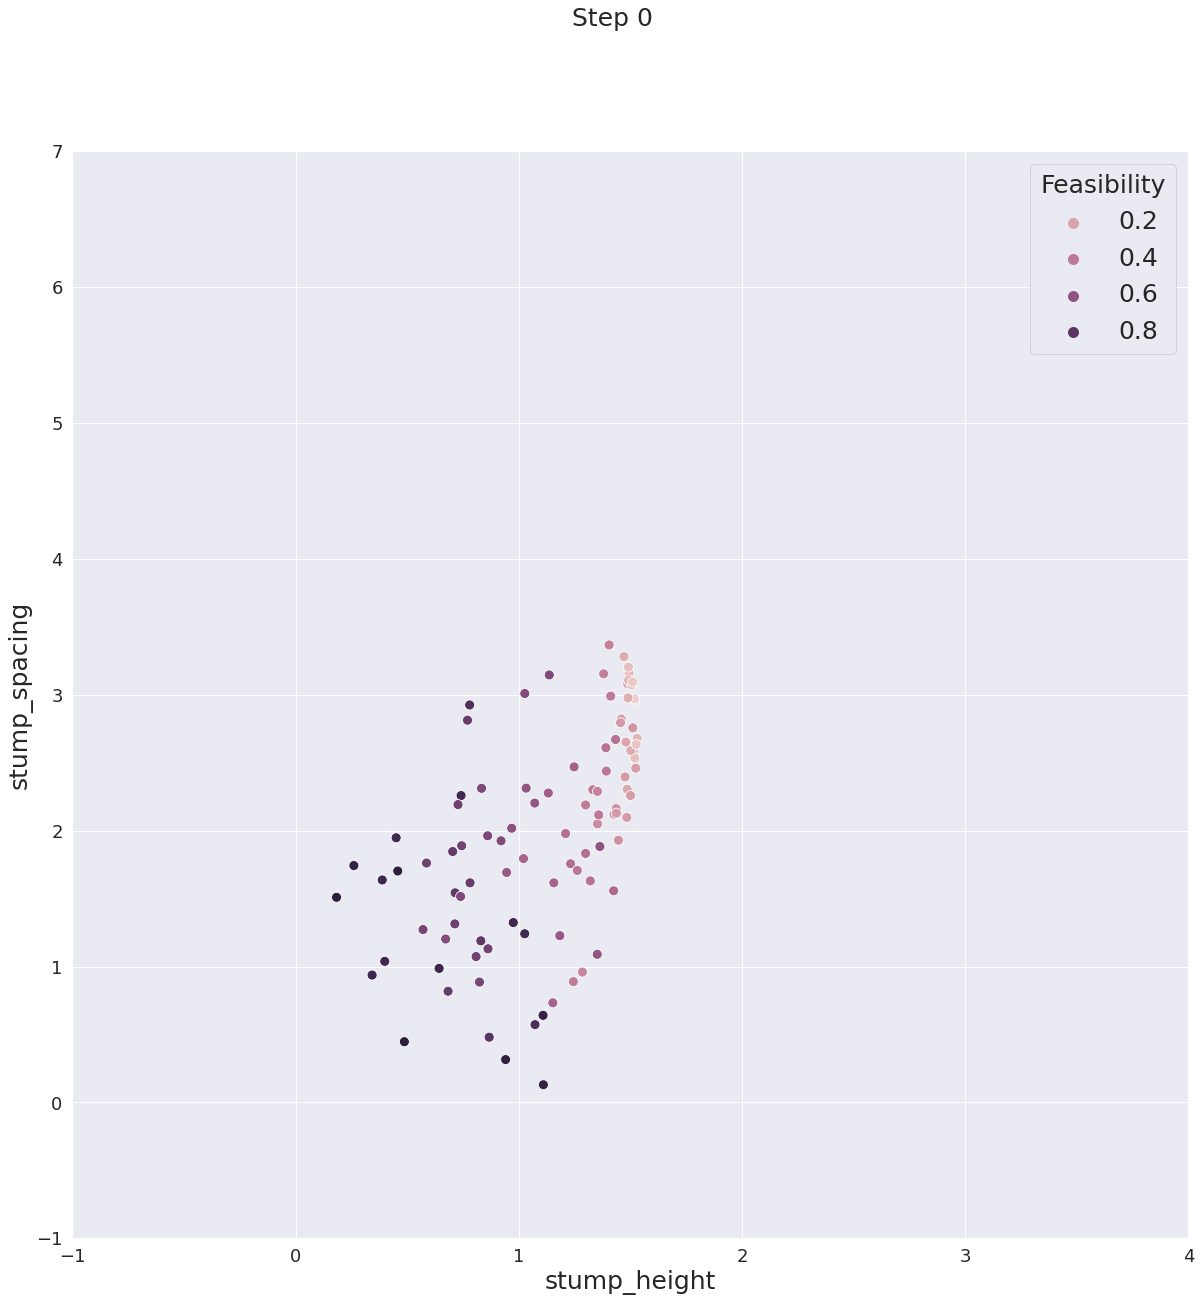
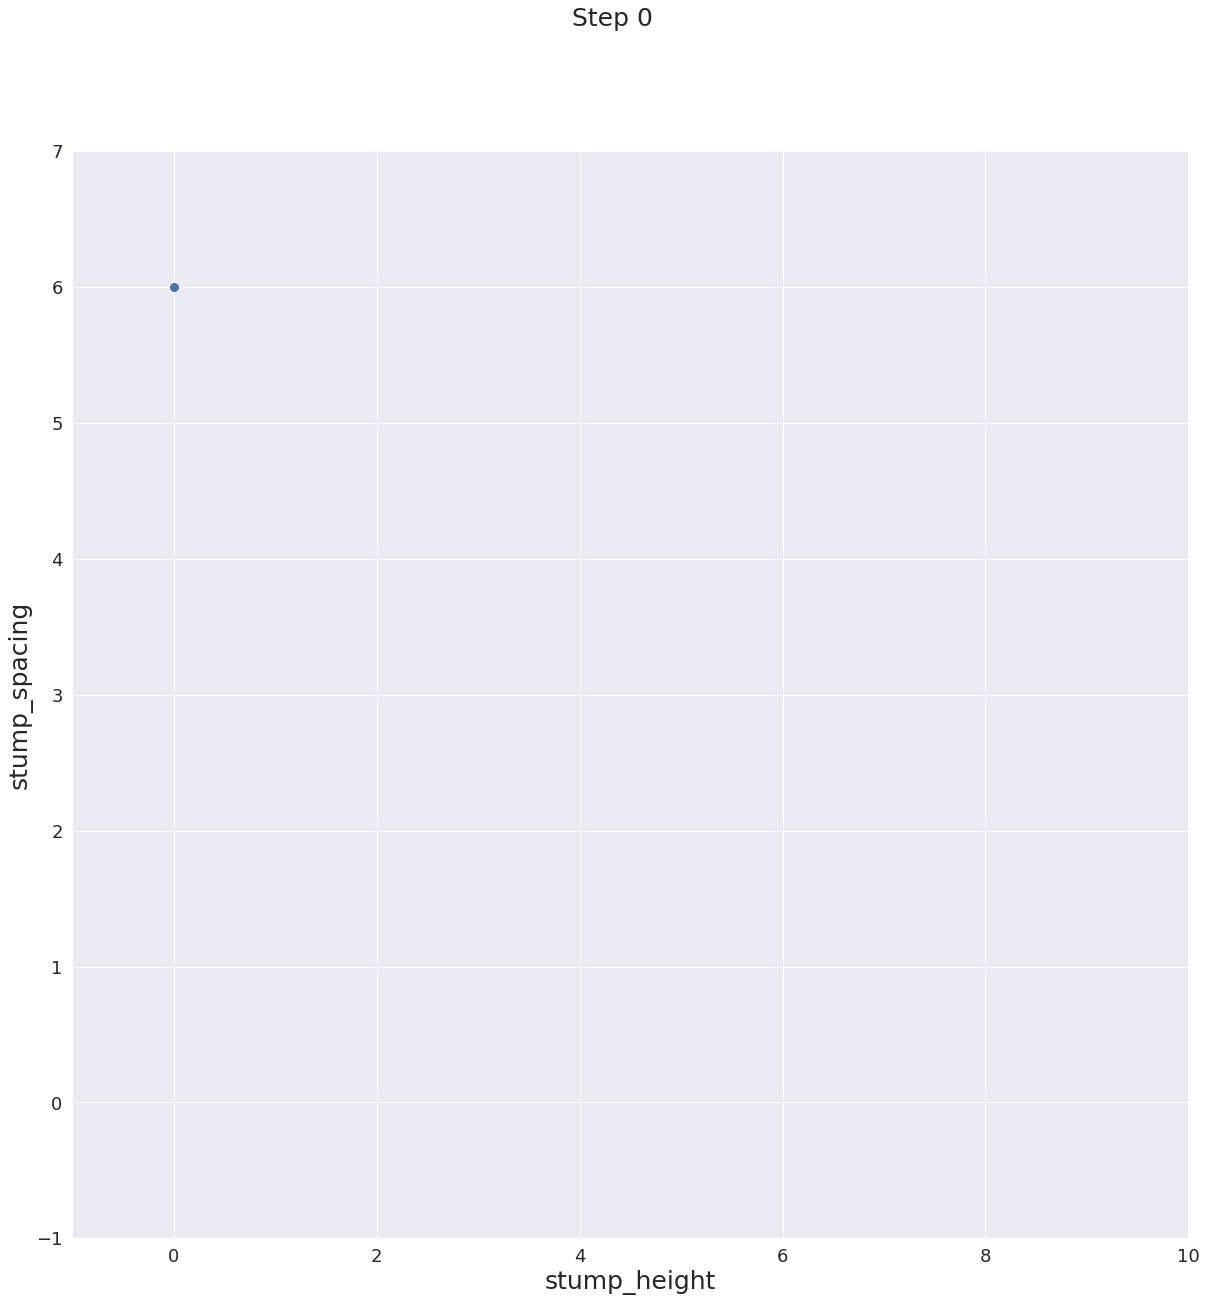
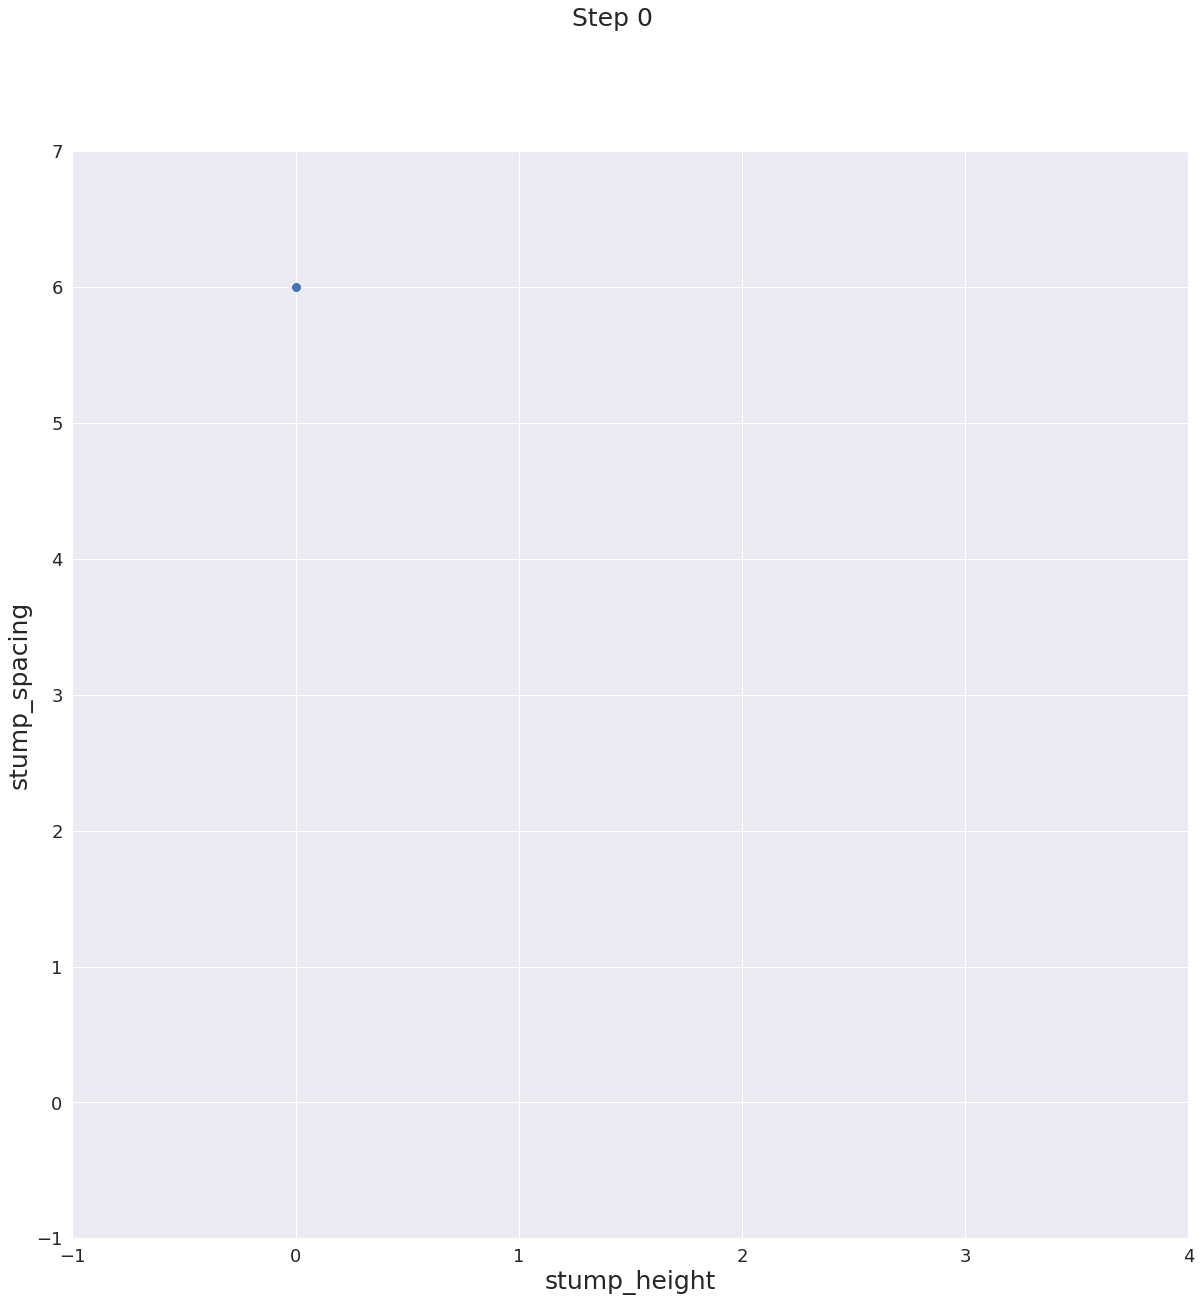
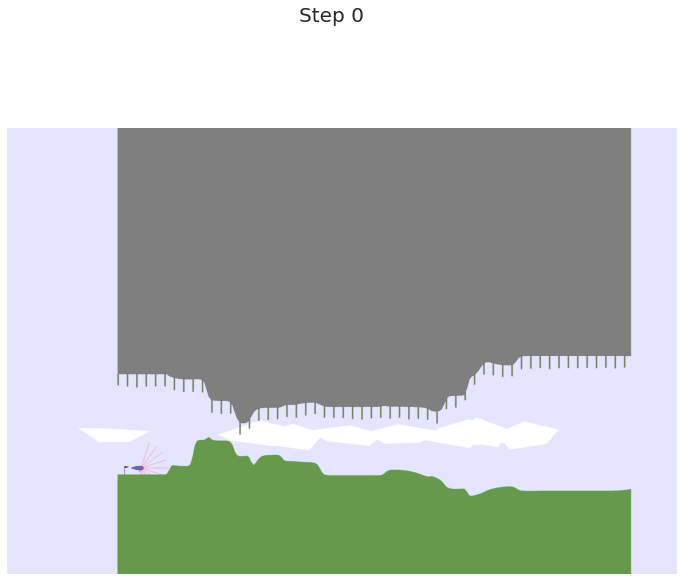
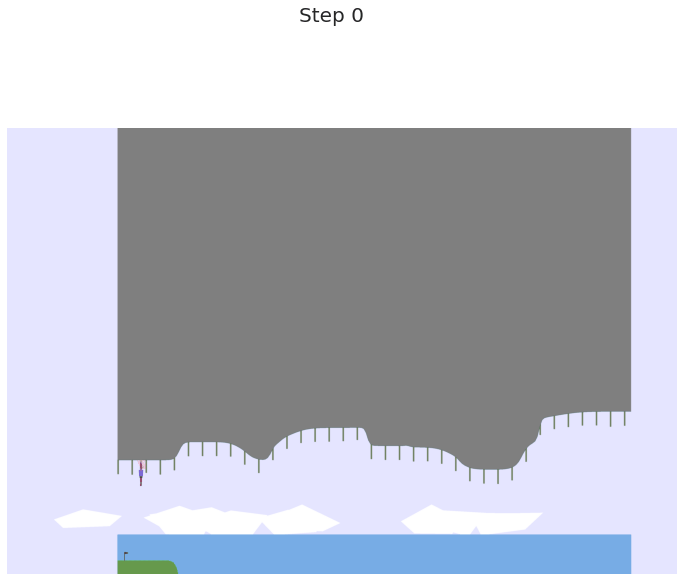
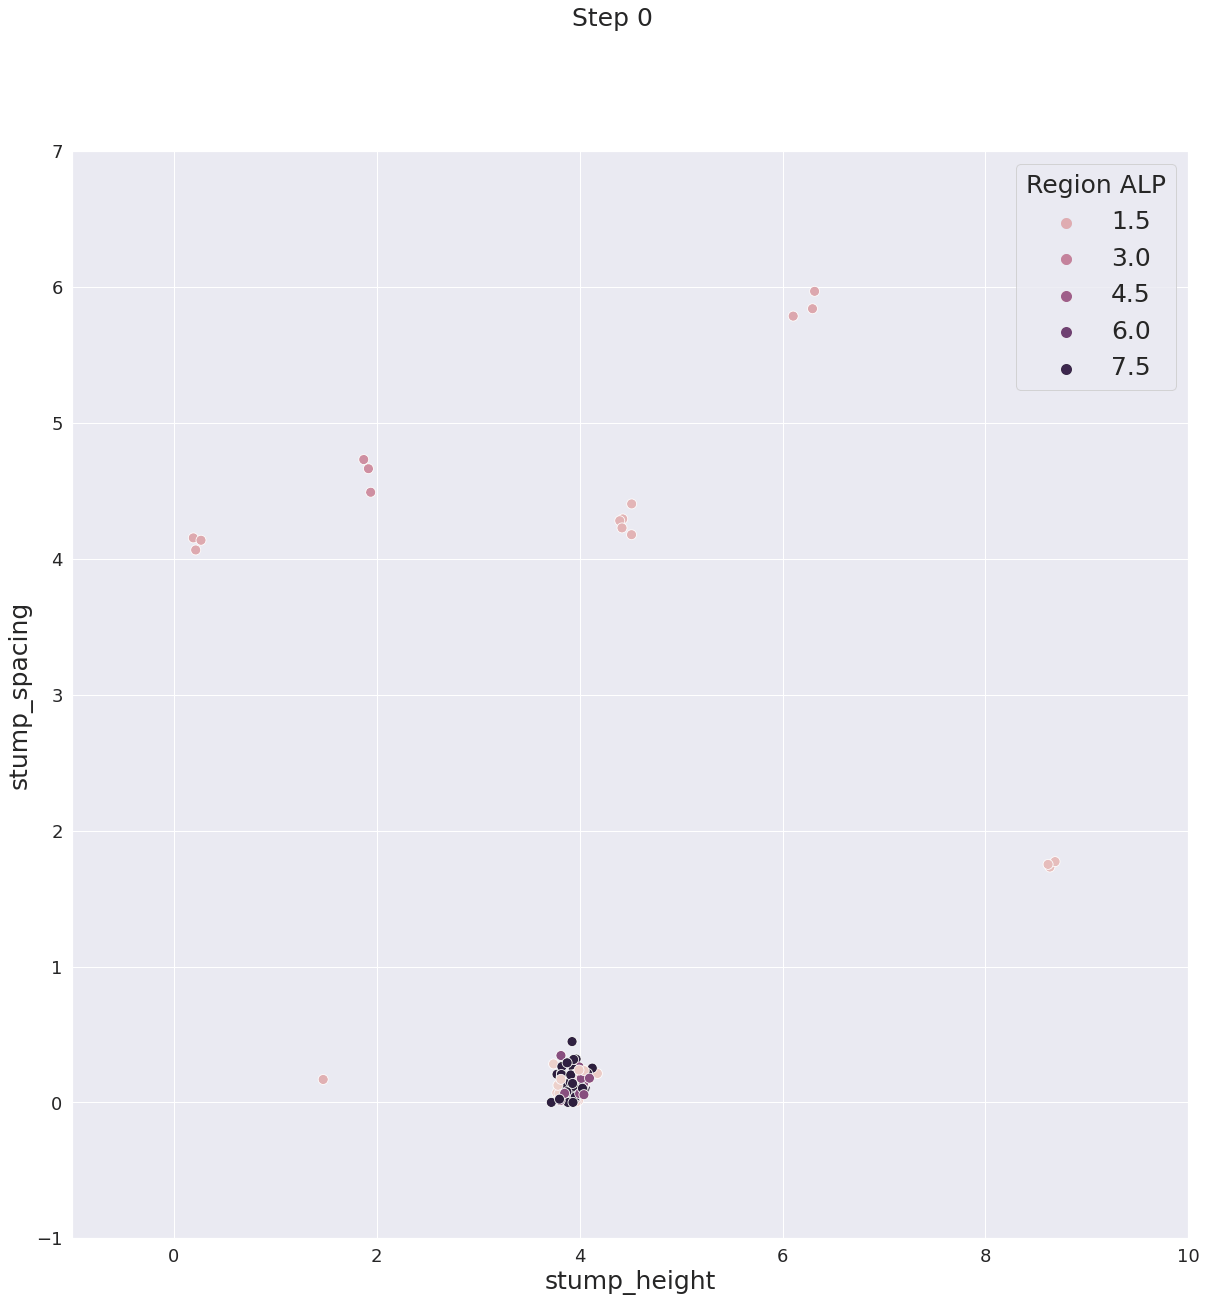
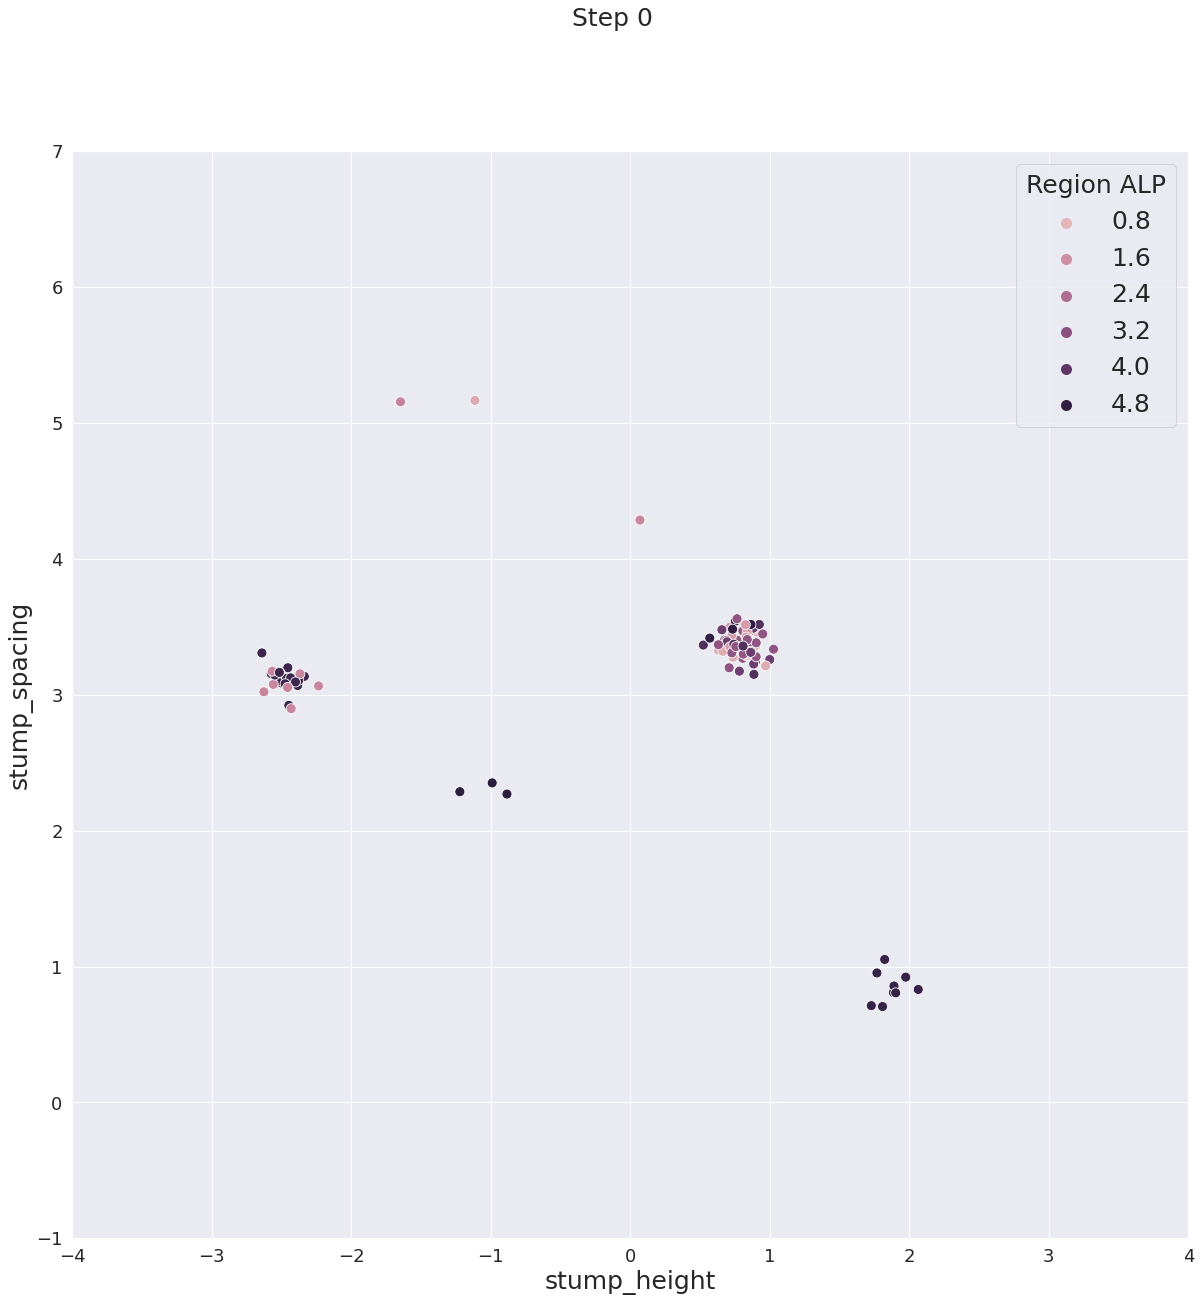
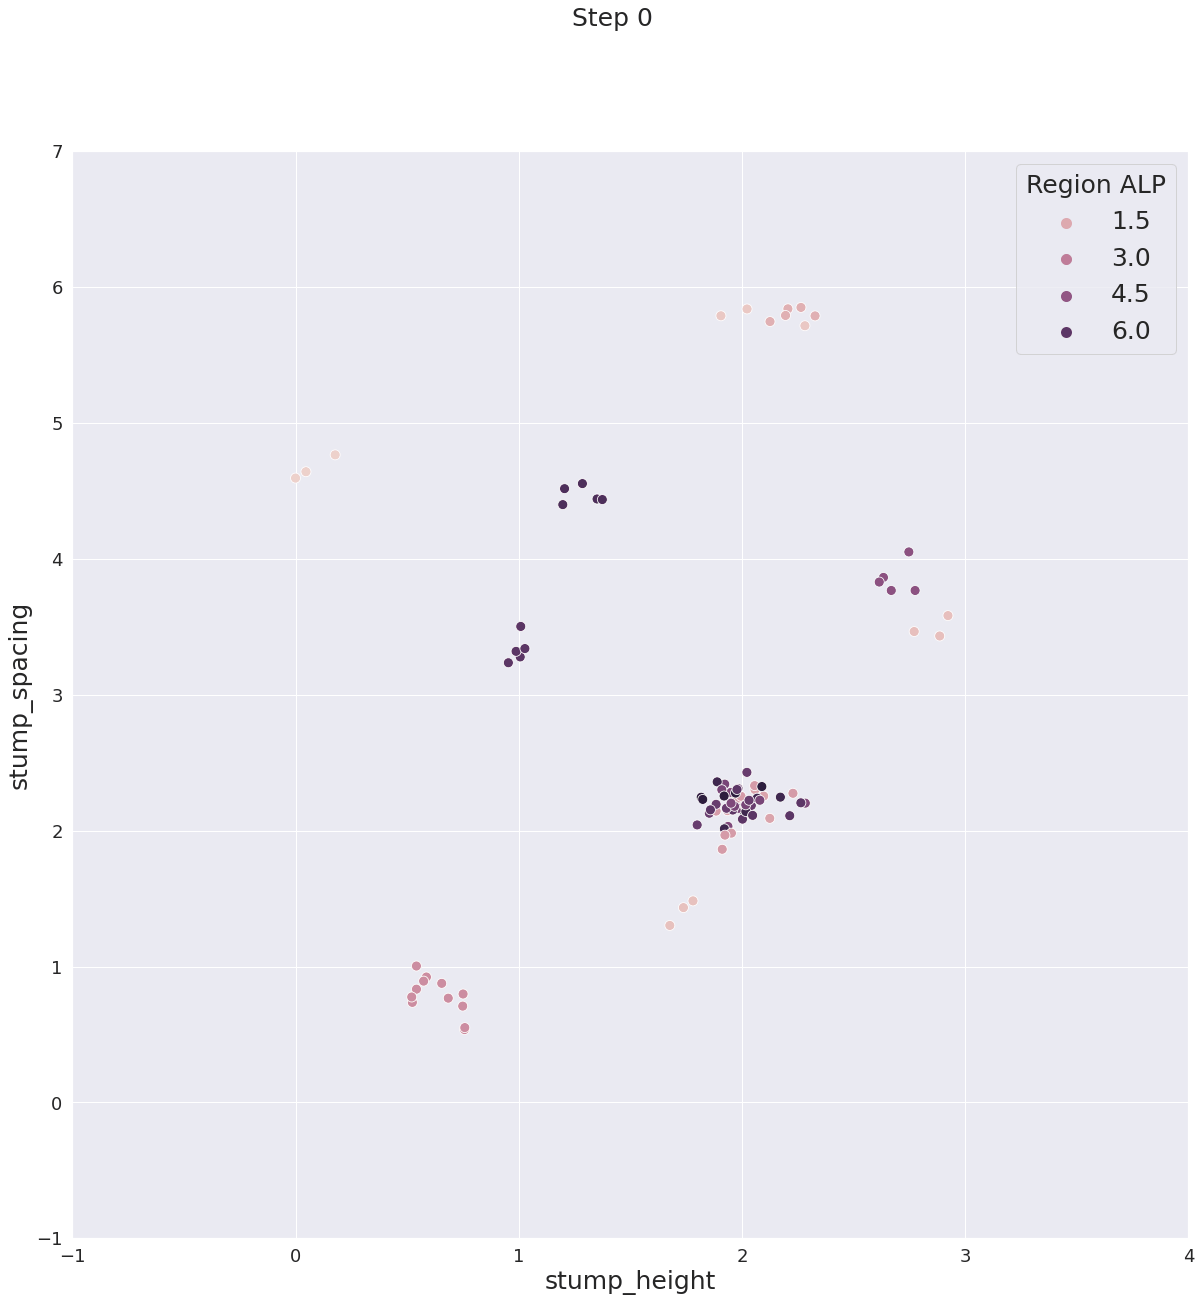
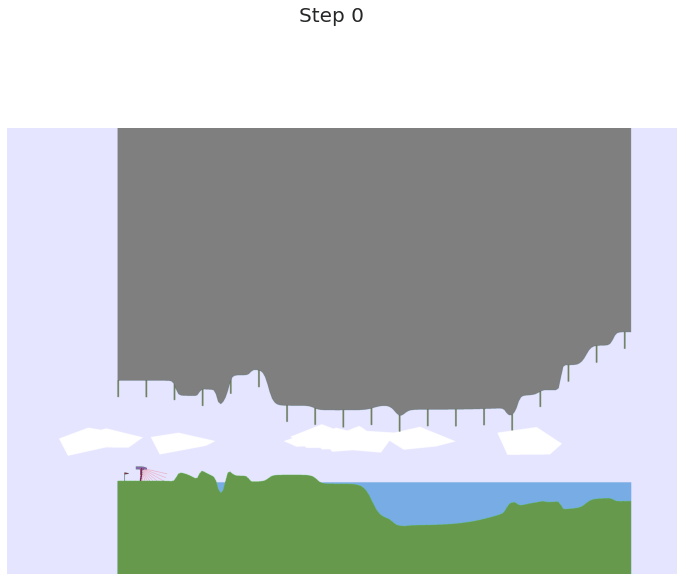
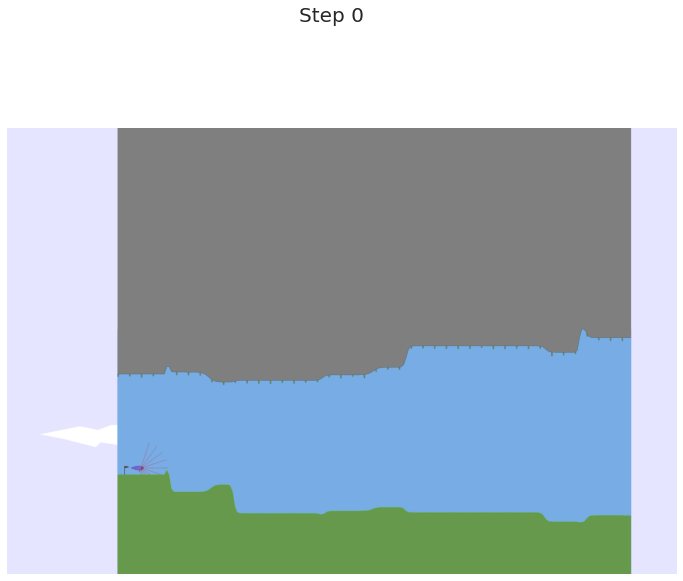
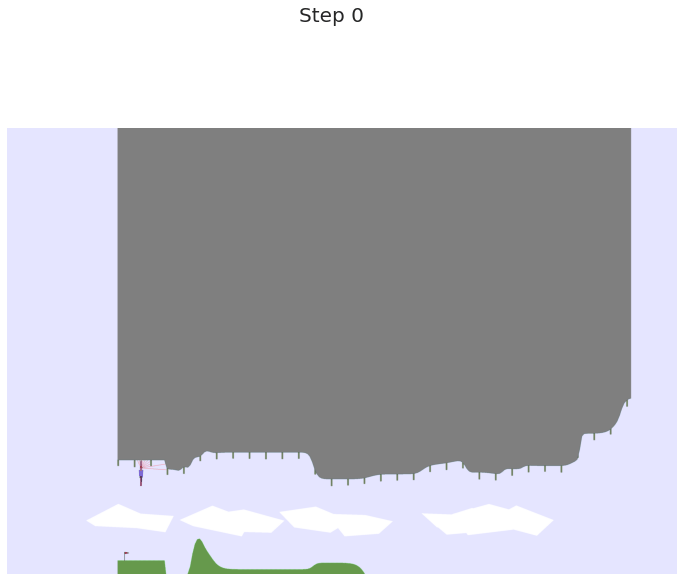
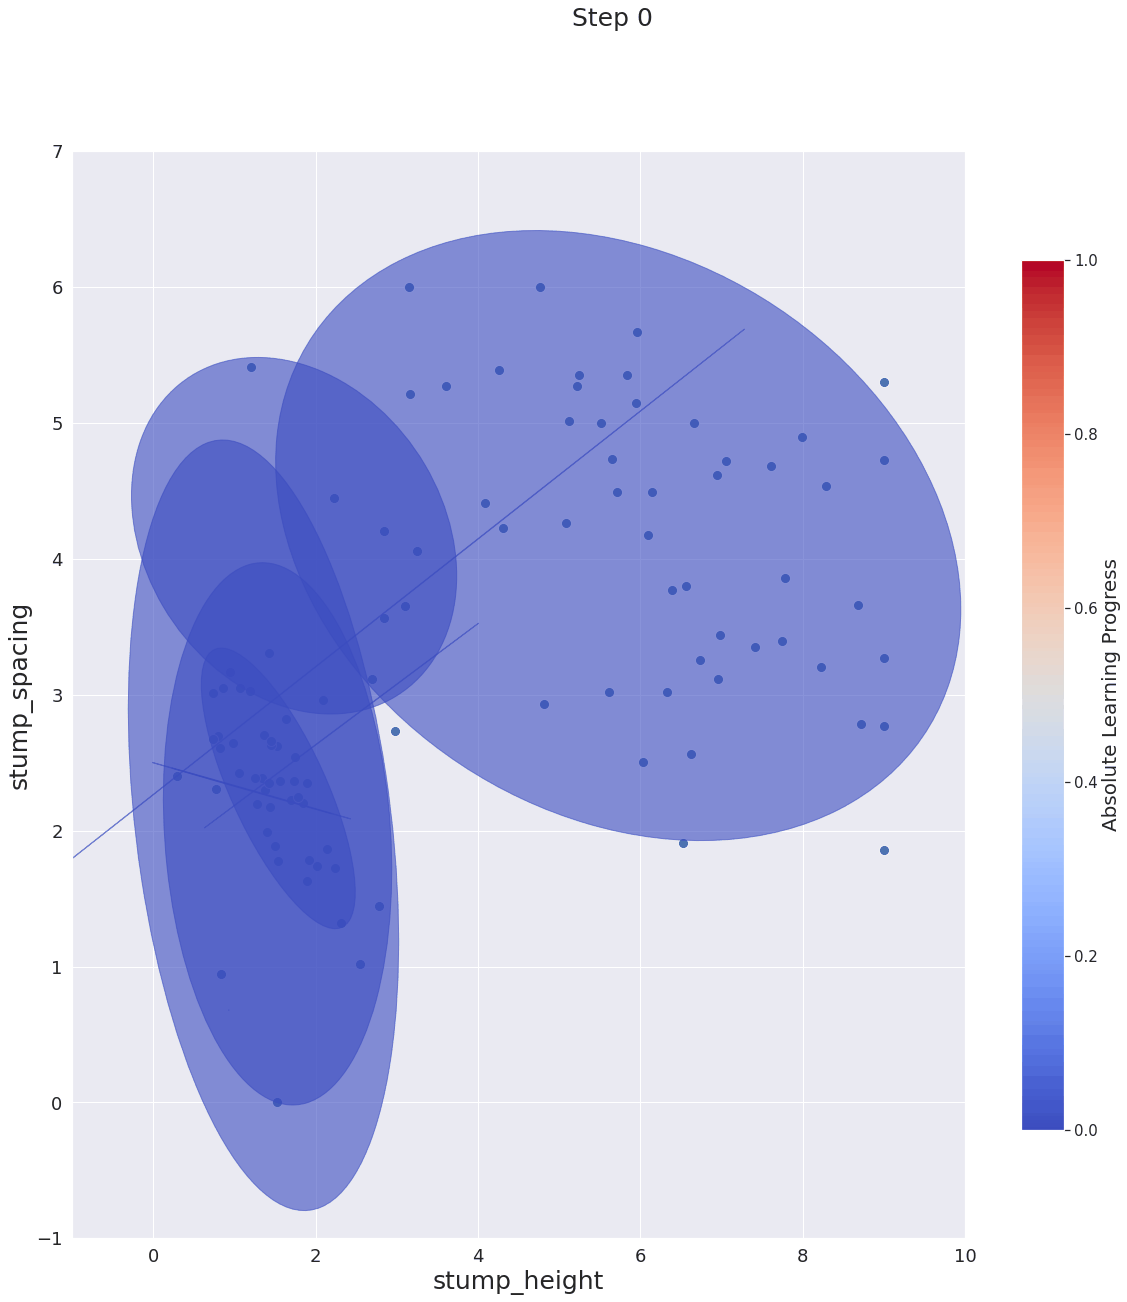
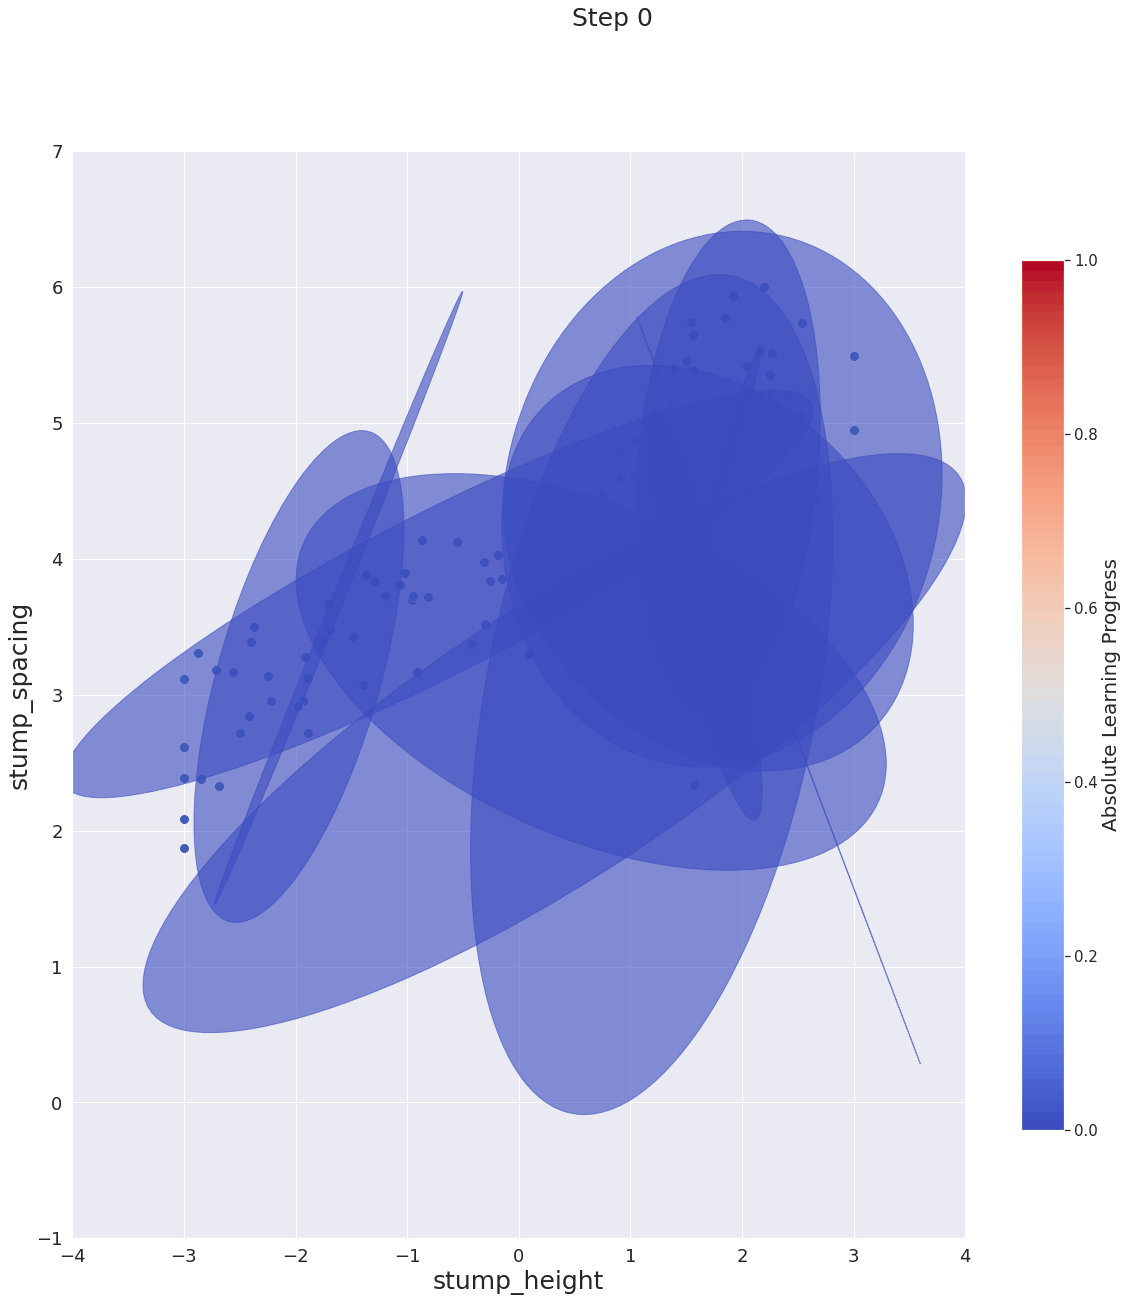
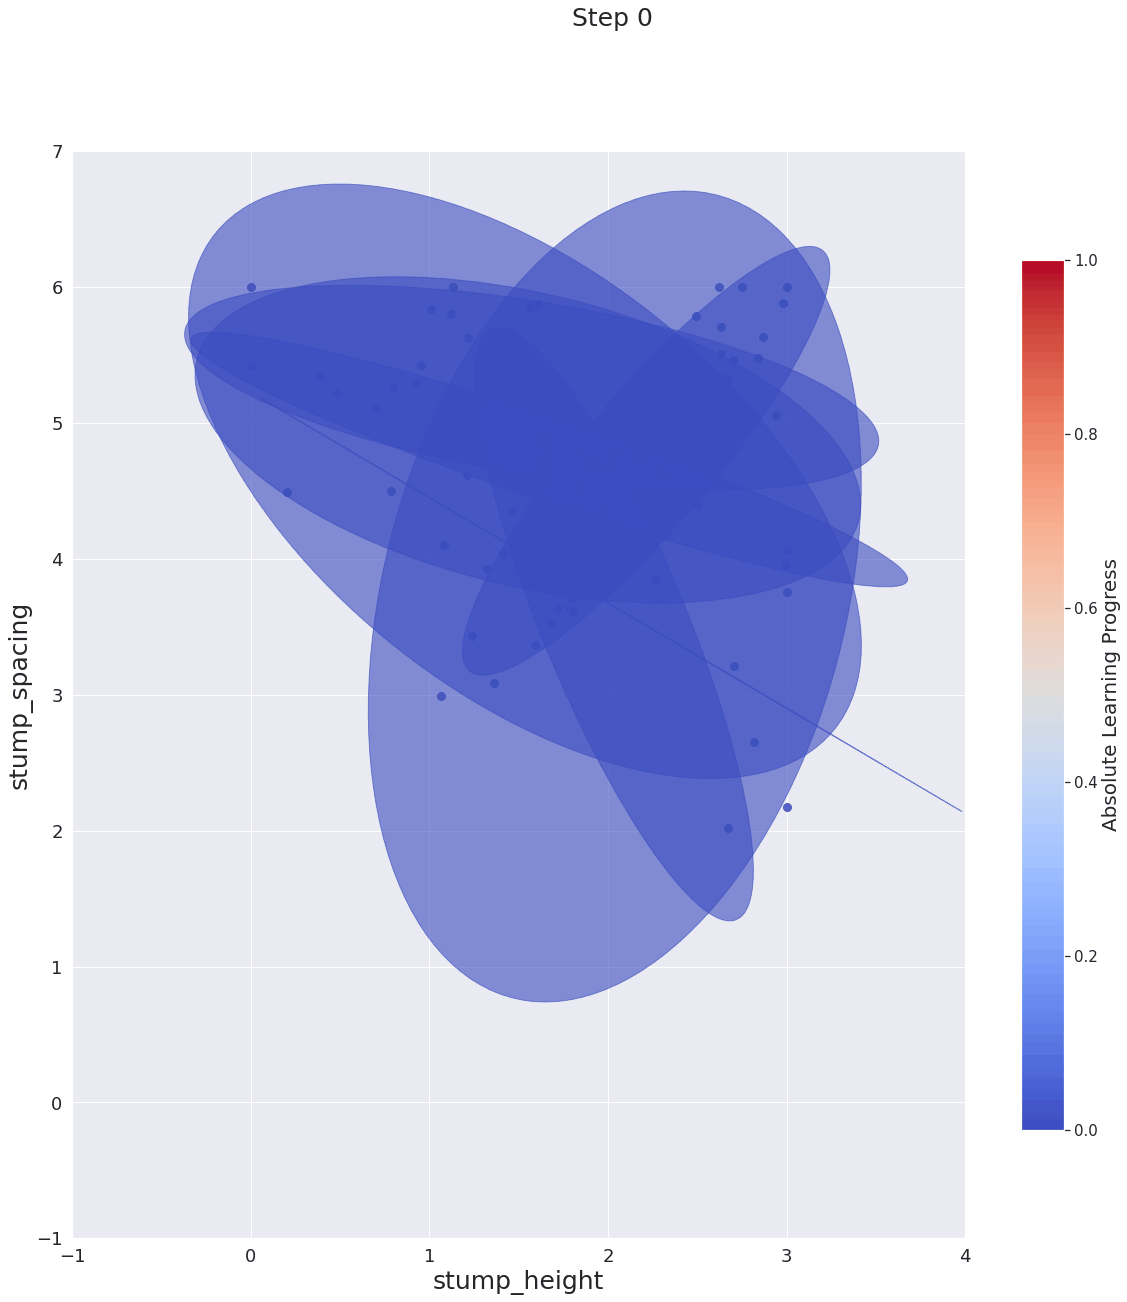
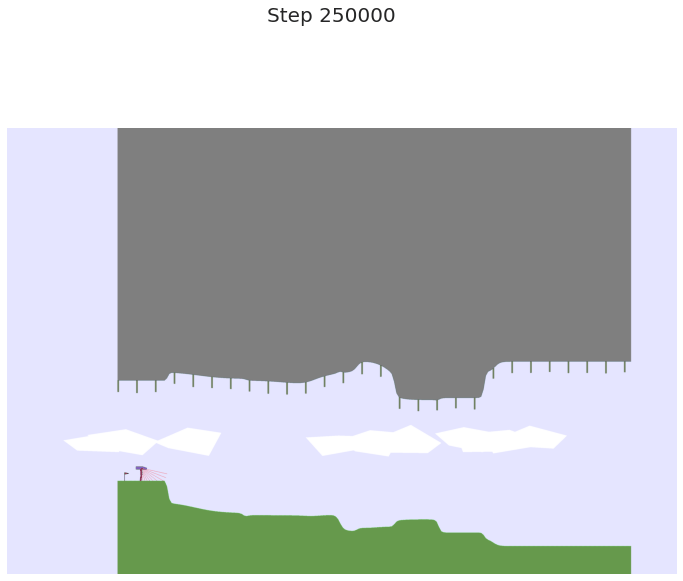
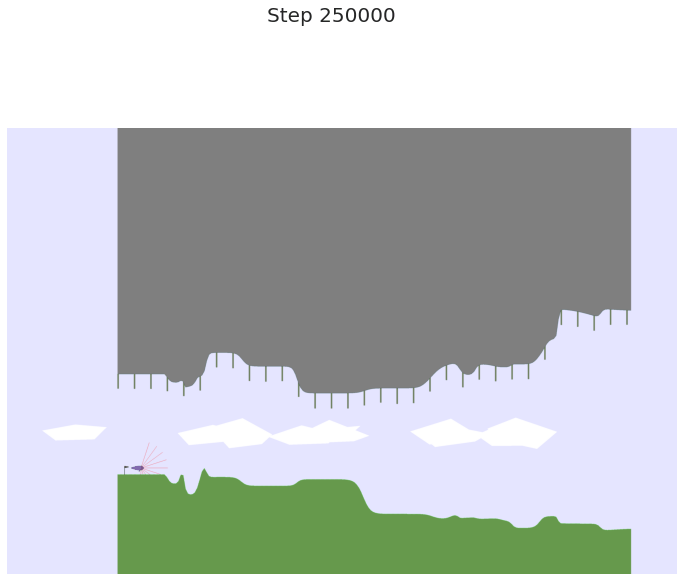
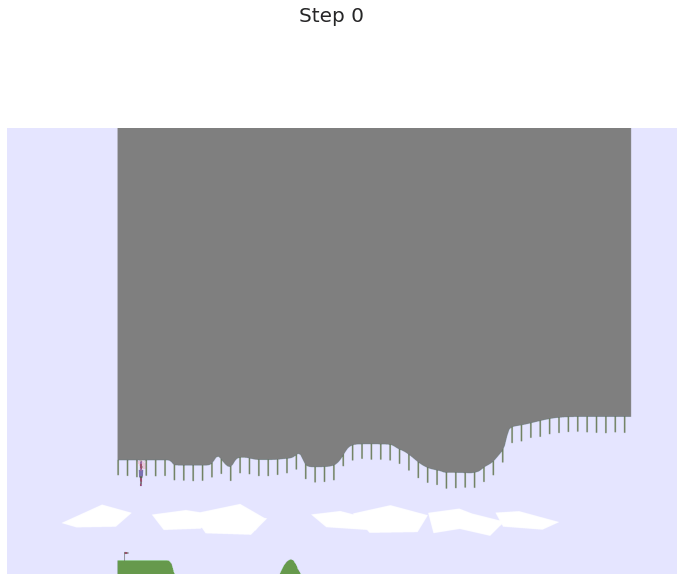
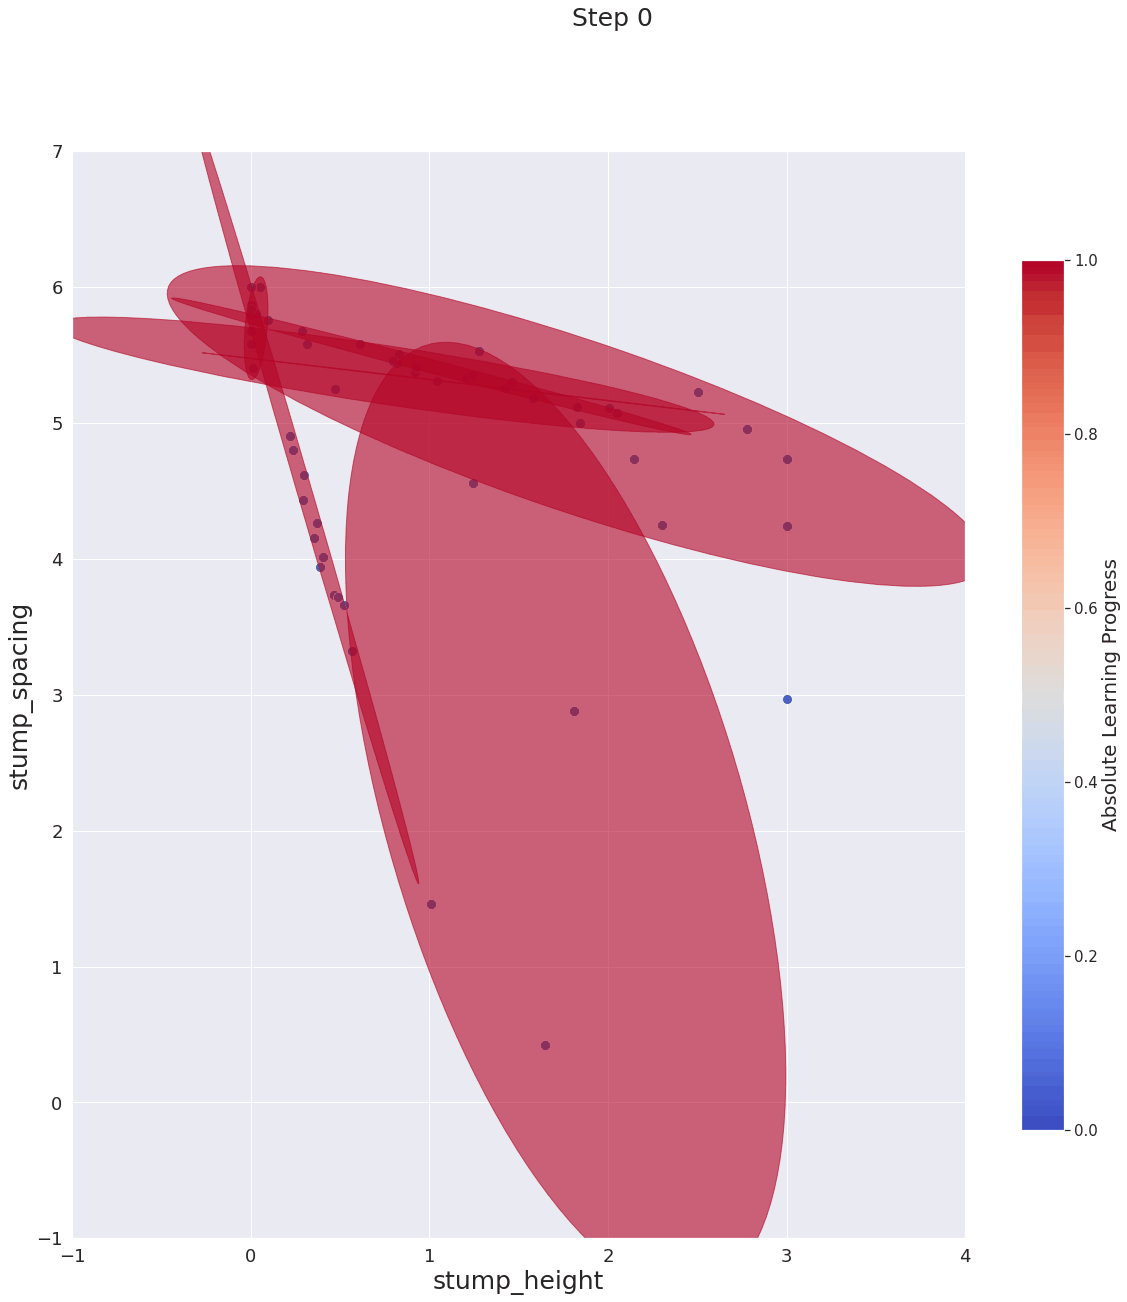
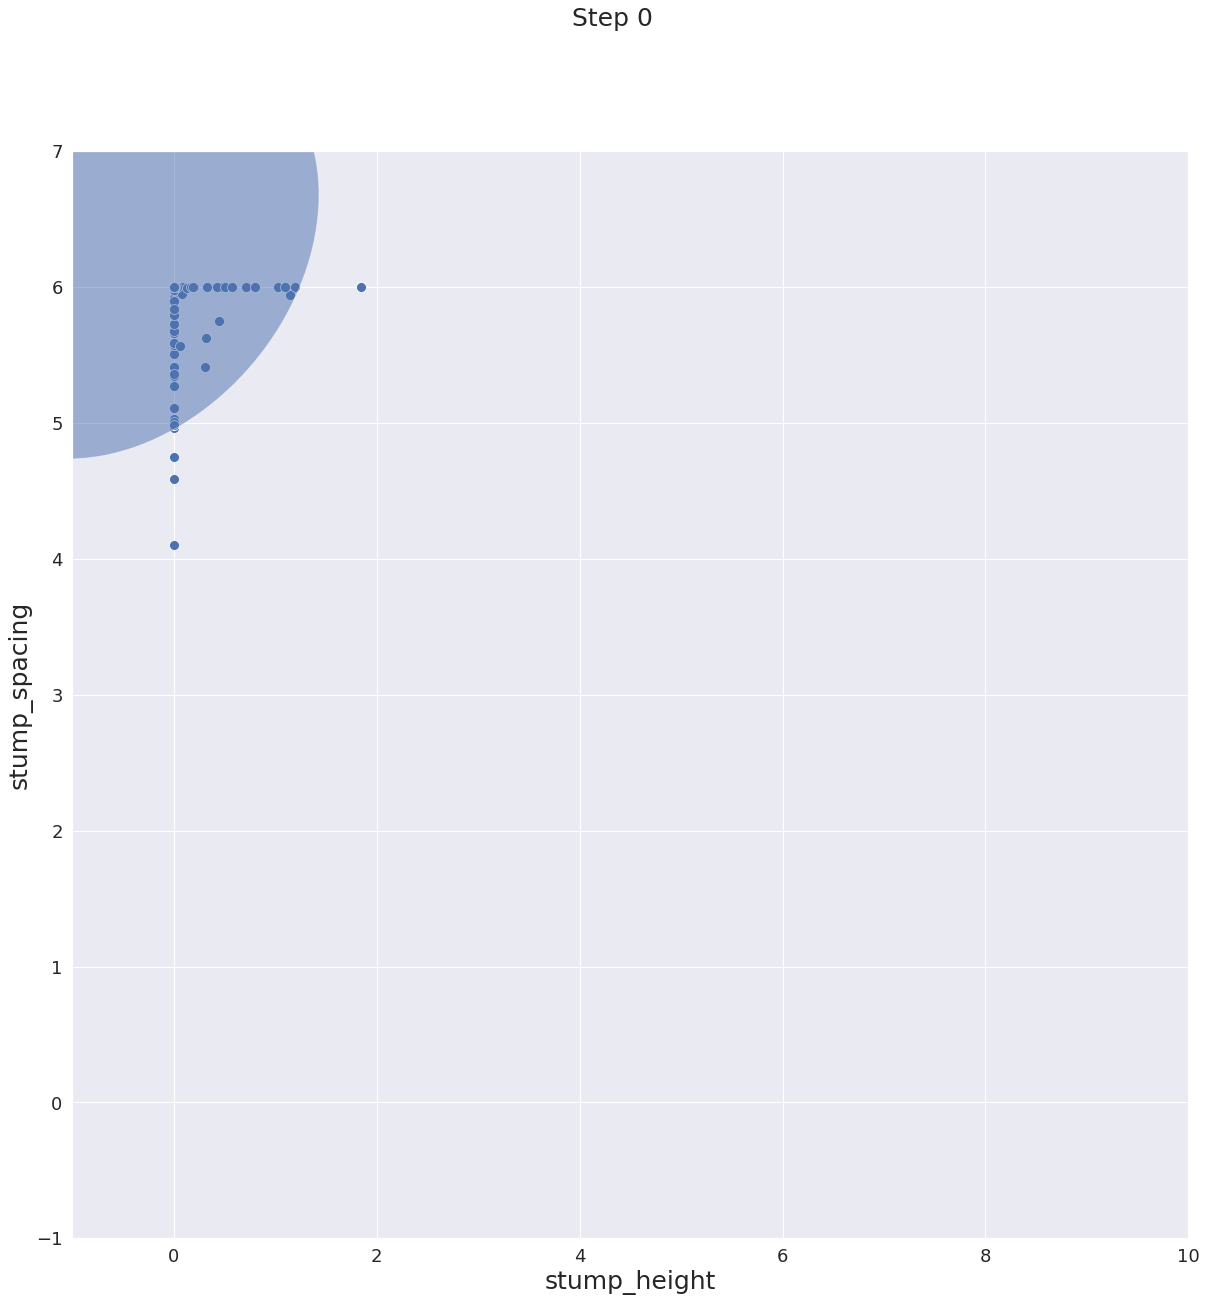
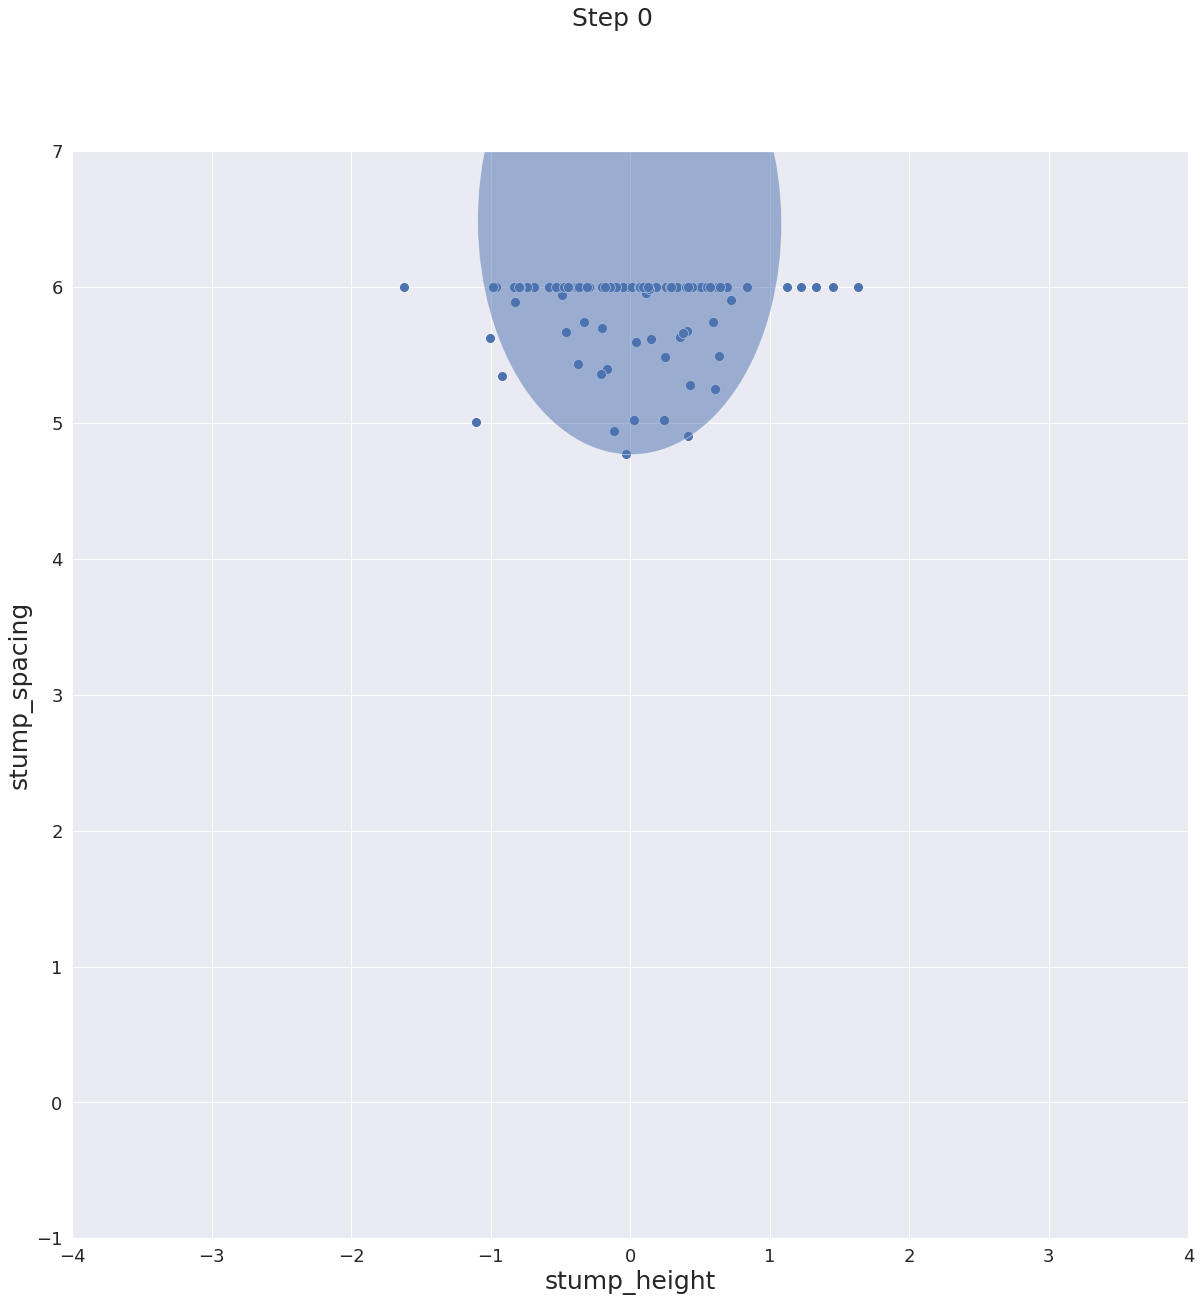
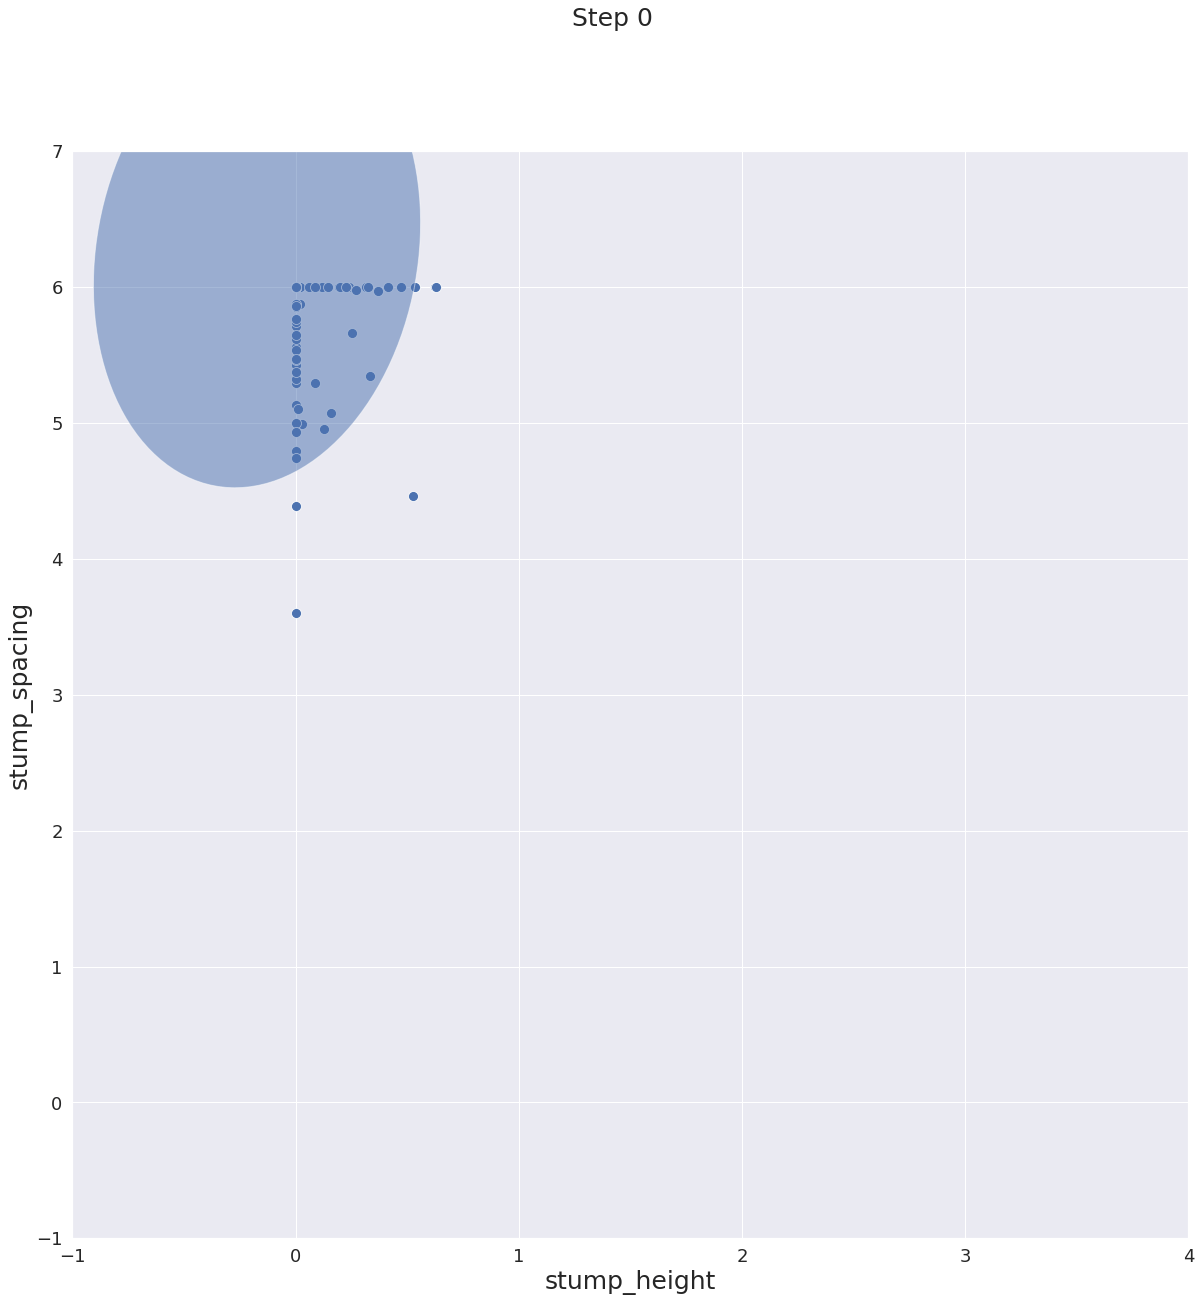
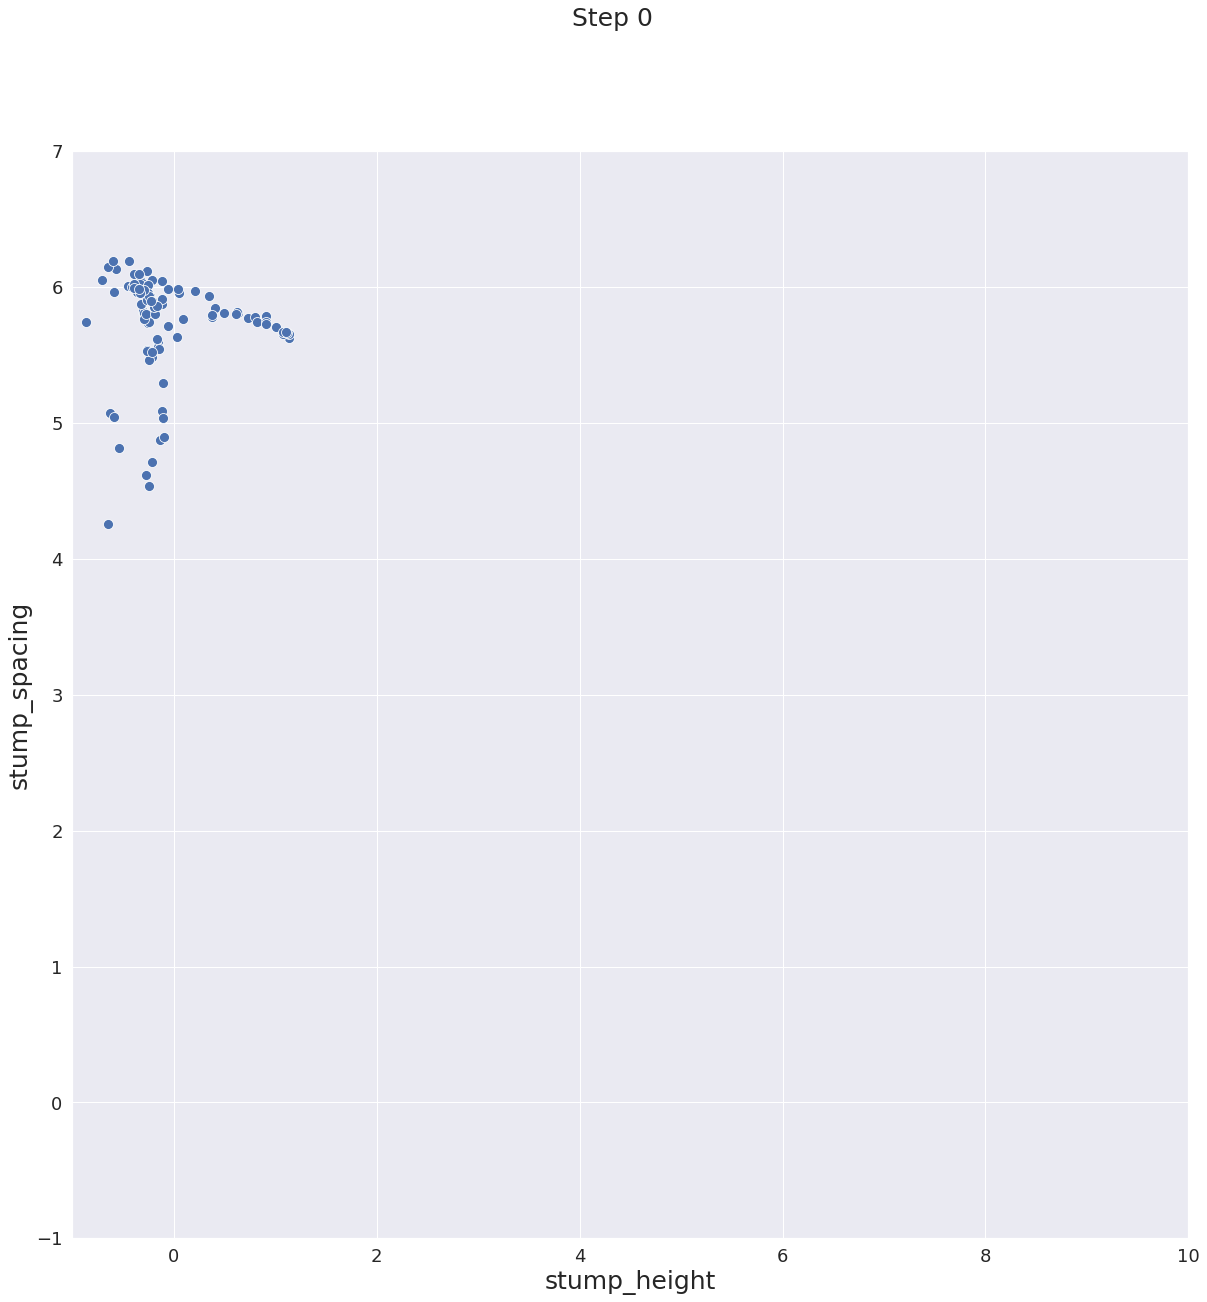
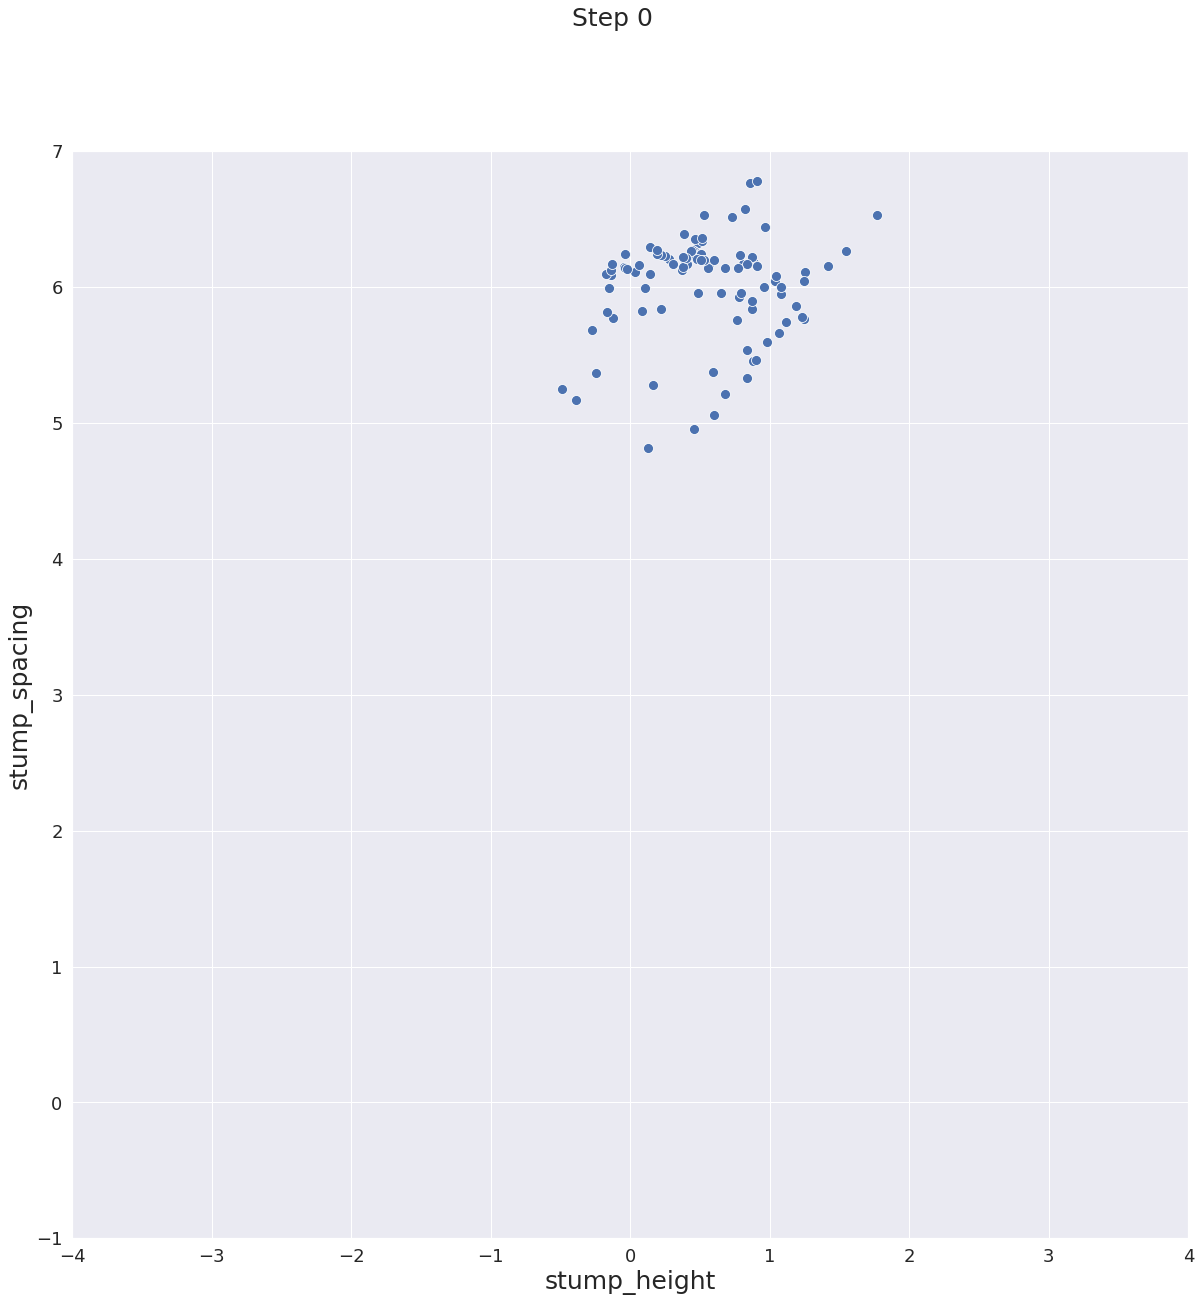
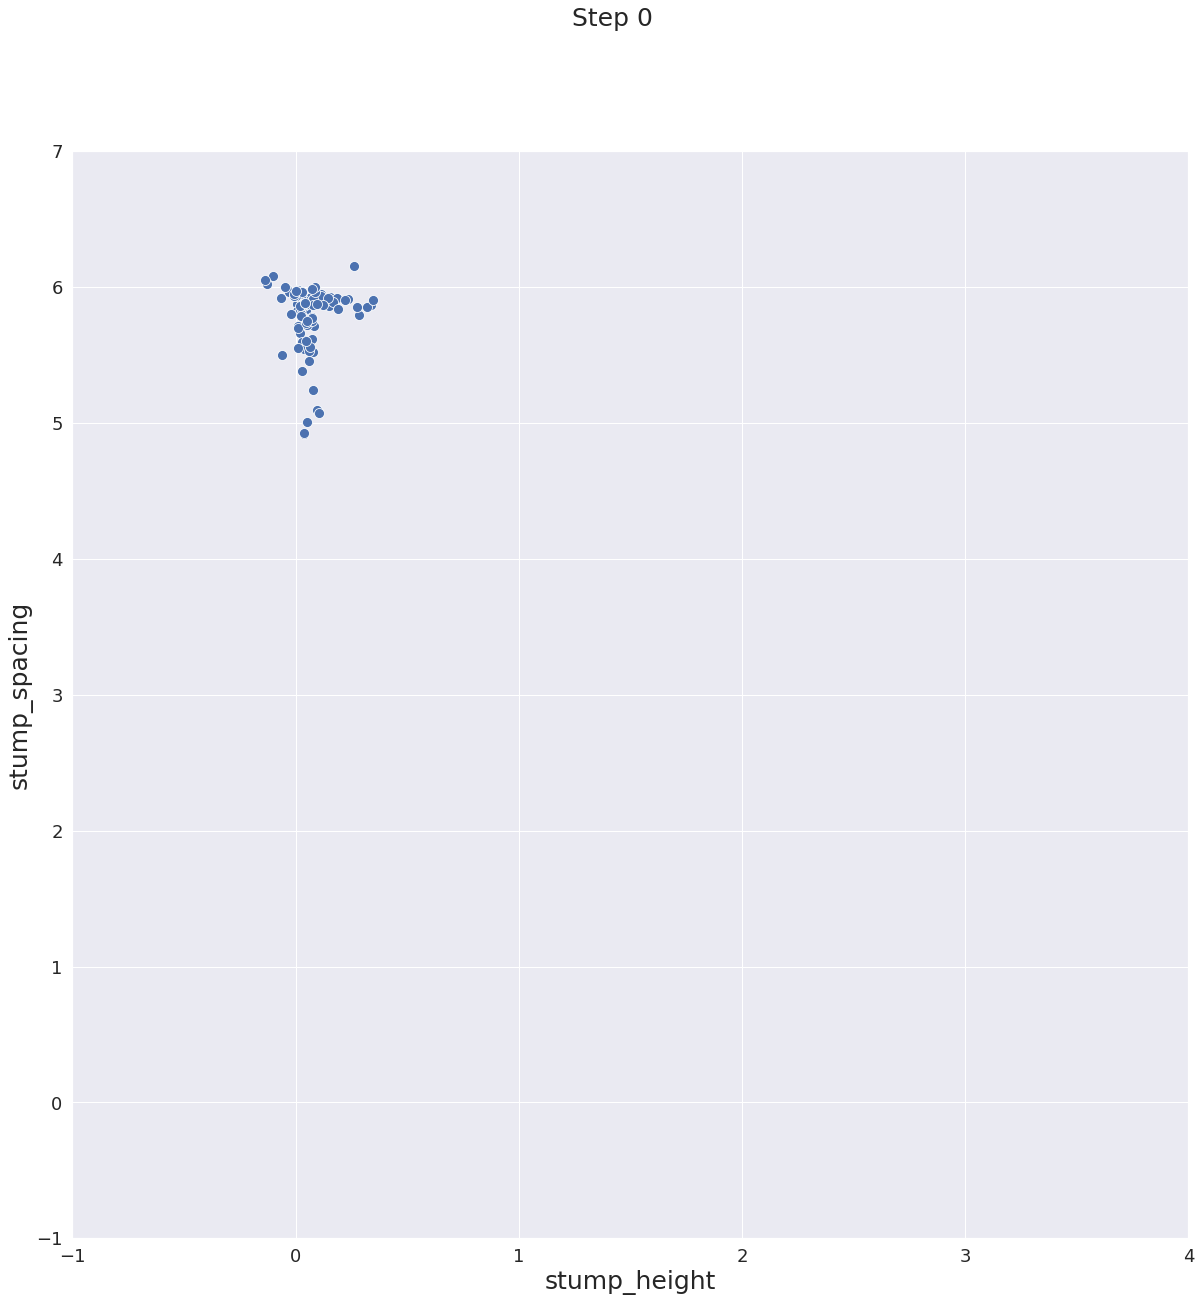
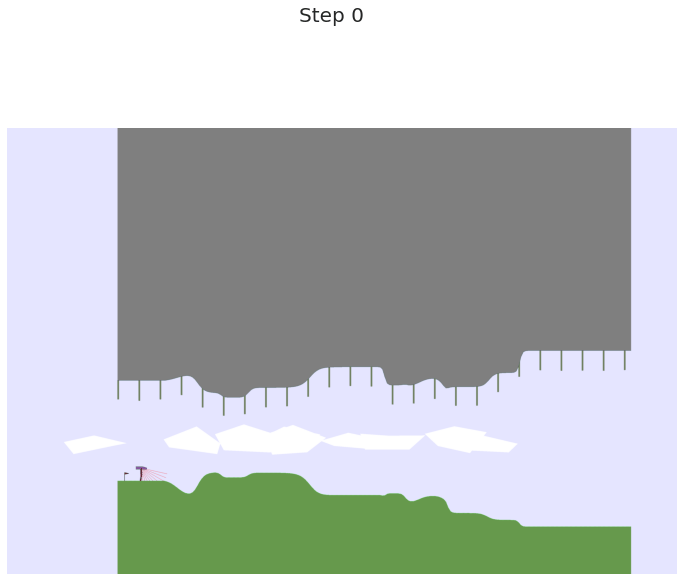
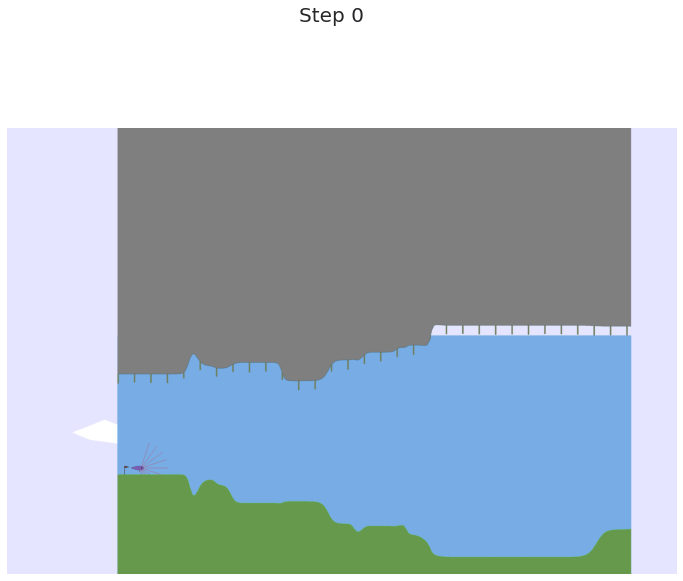
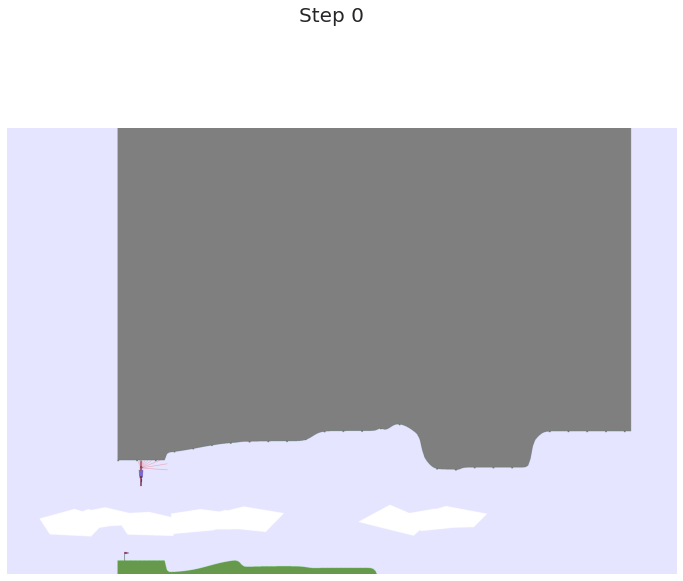
We provide visualizations helping to understand the curriculum generated by each of our ACL teachers. We ask the teacher to sample 100 tasks every 250000 steps of the DRL student and store them. For this sampling, we use the non-exploratory part of our teachers (e.g. ALP-GMM always samples from its GMM or ADR never sets one value to one of its bounds). We propose below visualizations of these tasks using gifs showing the evolution from step 0 to 2000000 for the best seed.

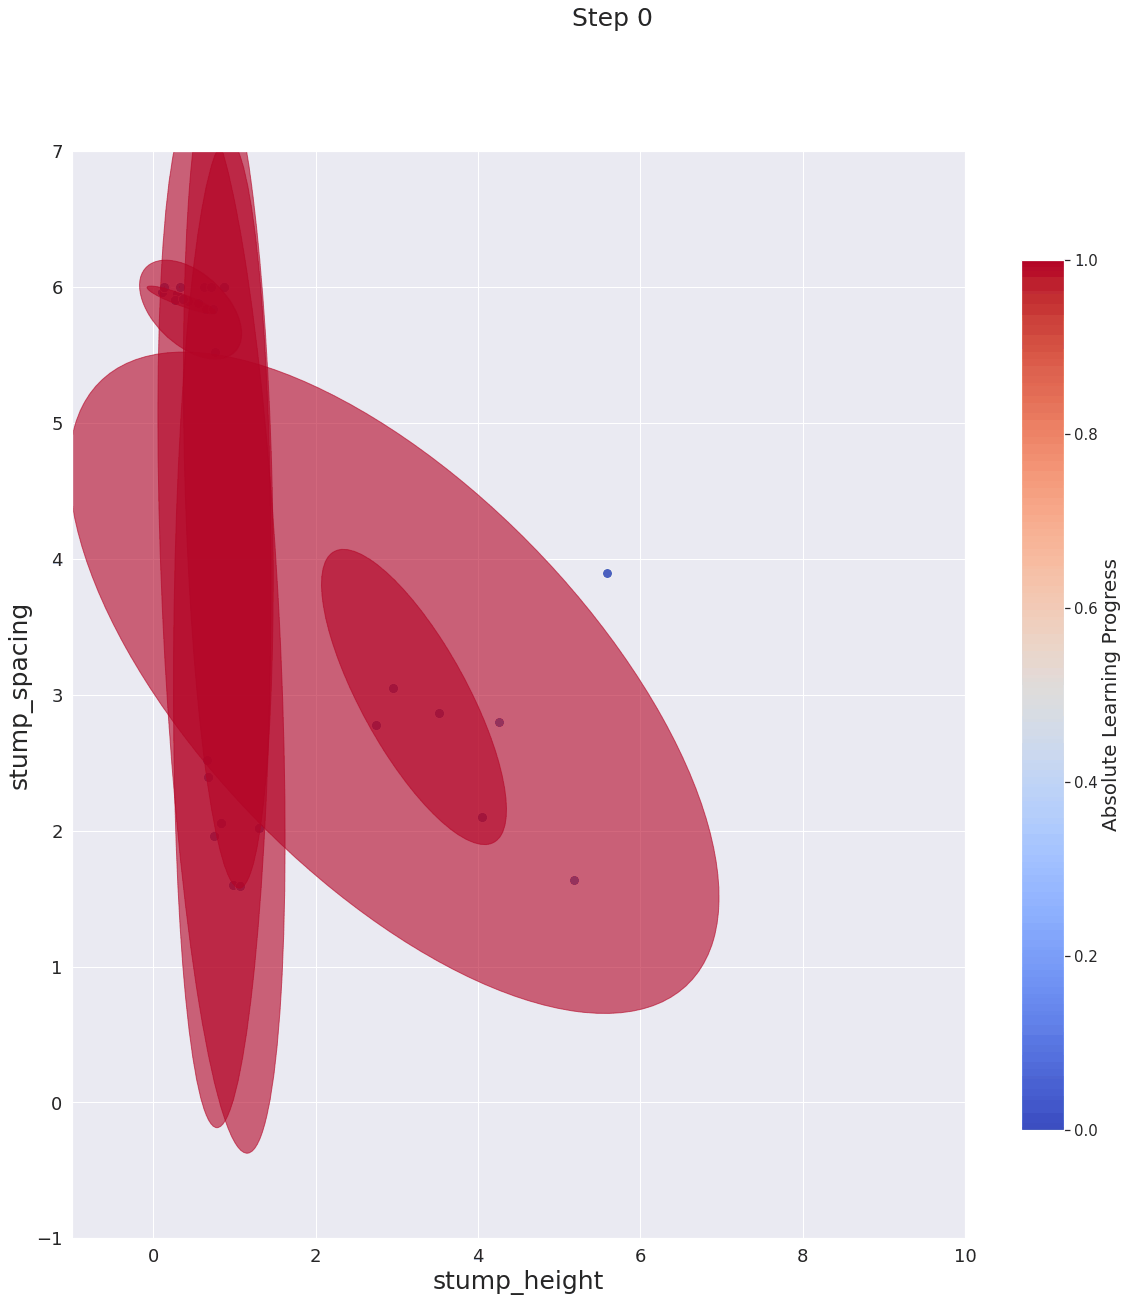
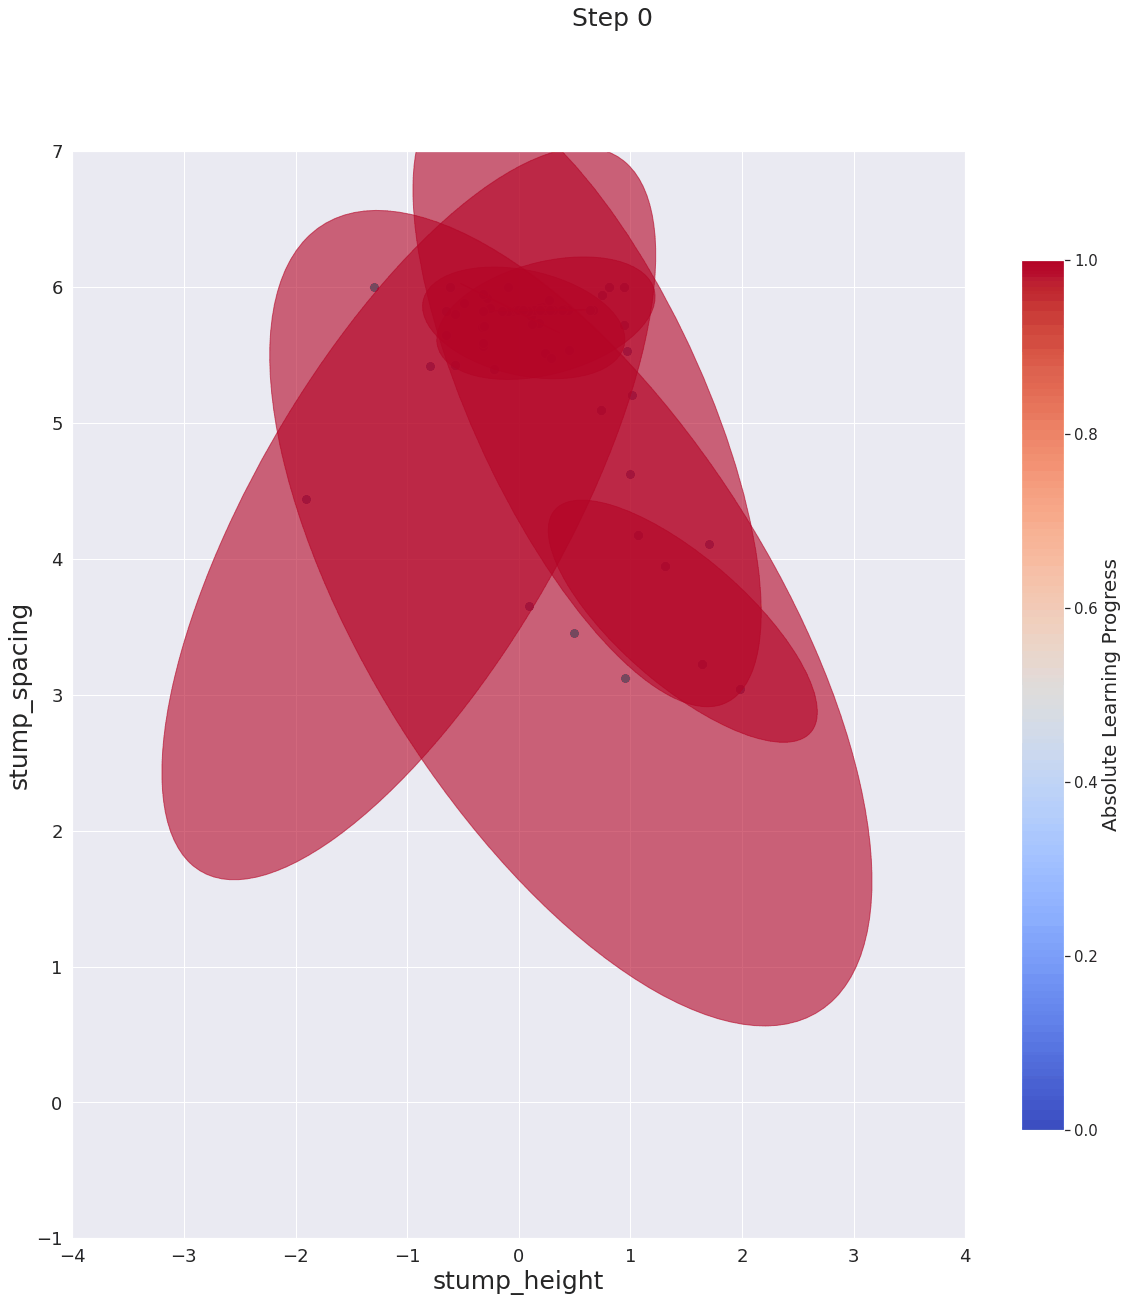
For each teacher, we first present the curriculum visualization for three of the challenge-specific experiments (mostly unfeasible task space, mostly trivial task space and forgetting student). We plot all the points (tasks) as well as additional information depending on the teacher.

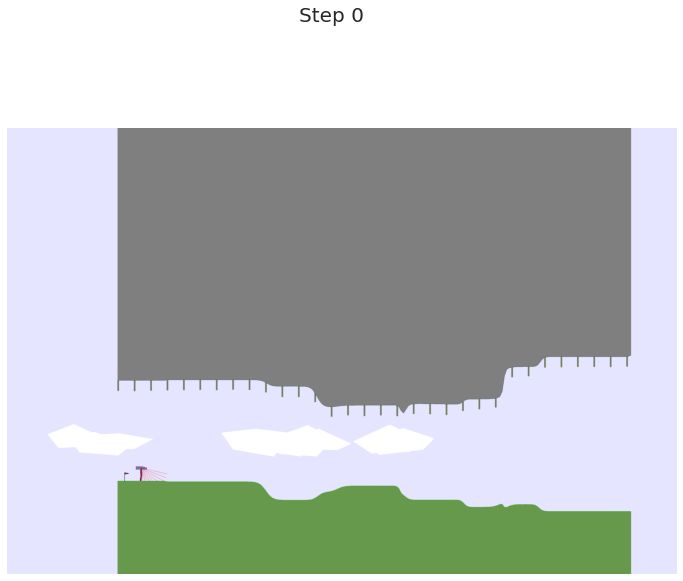
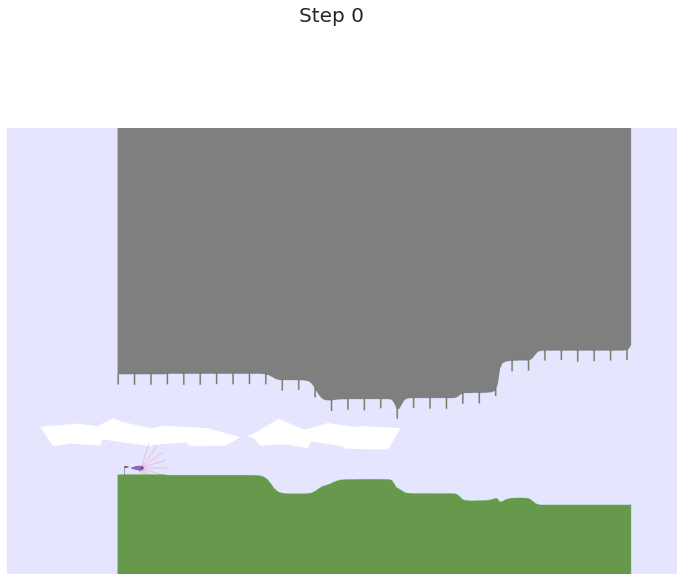
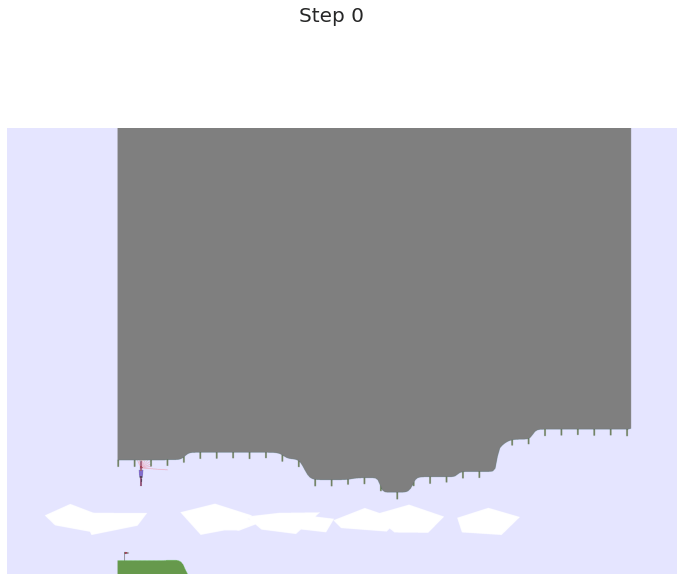
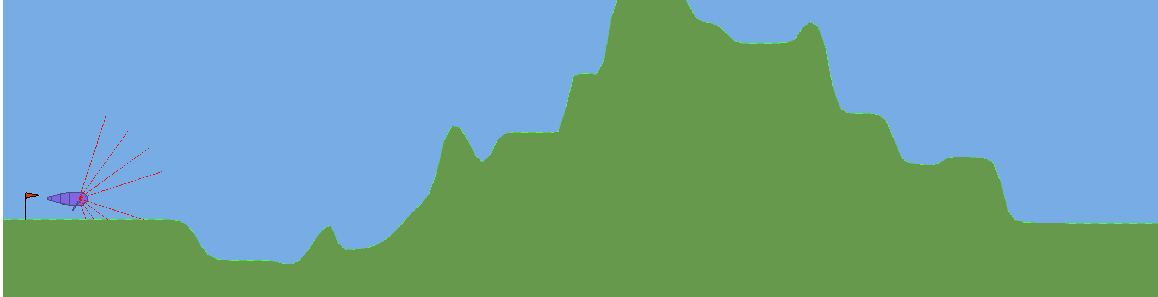
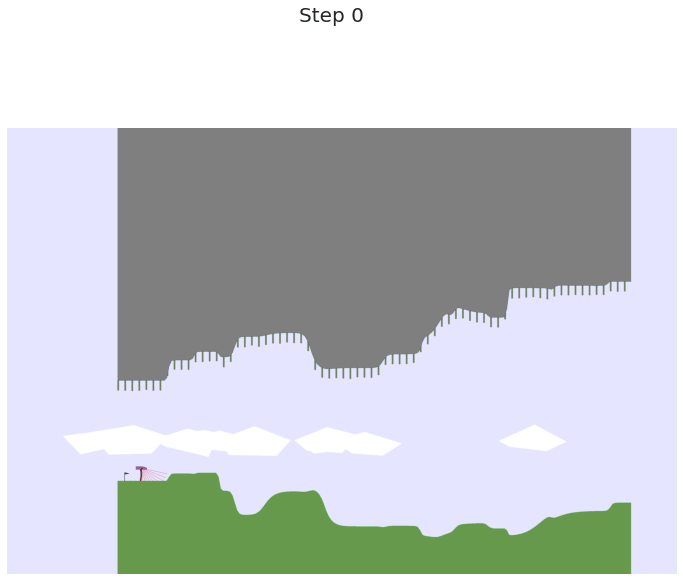
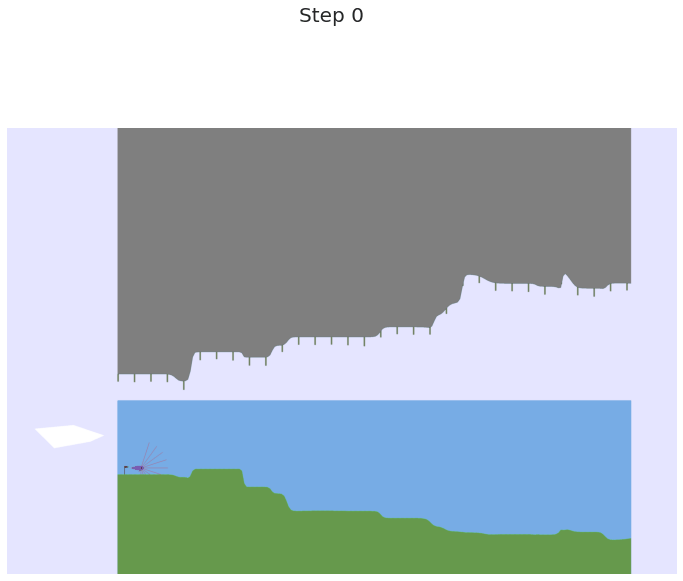
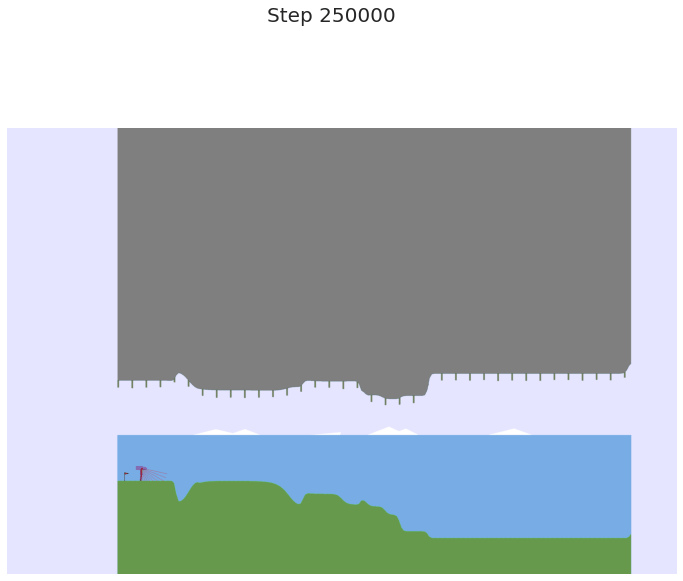
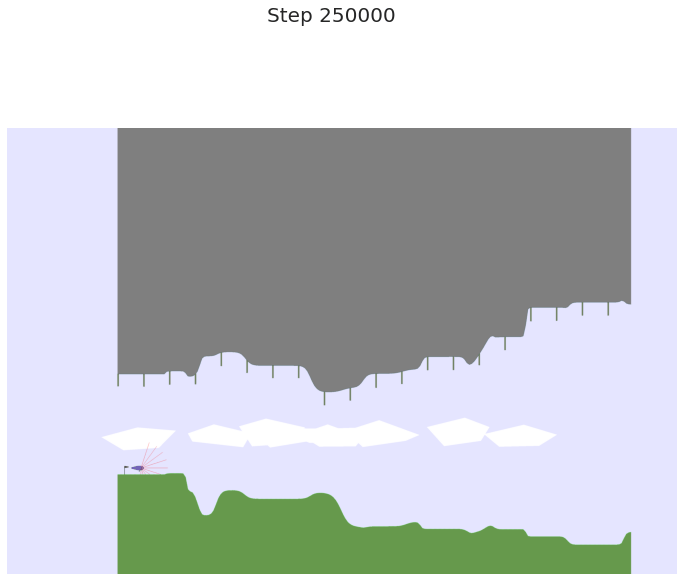
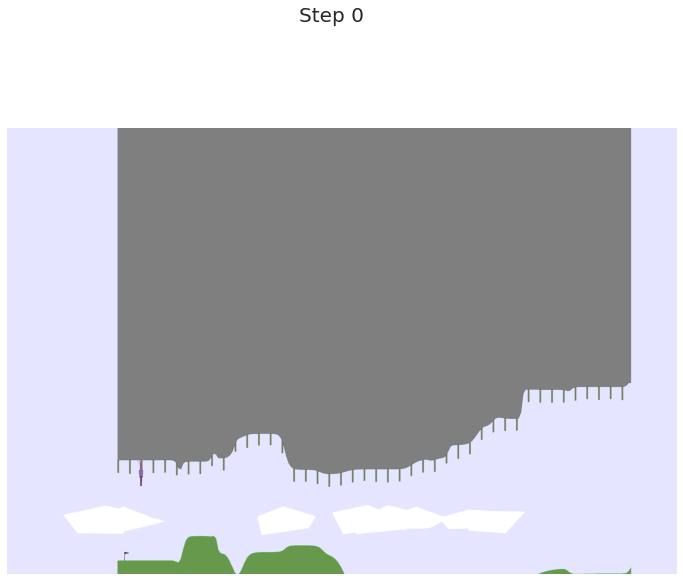
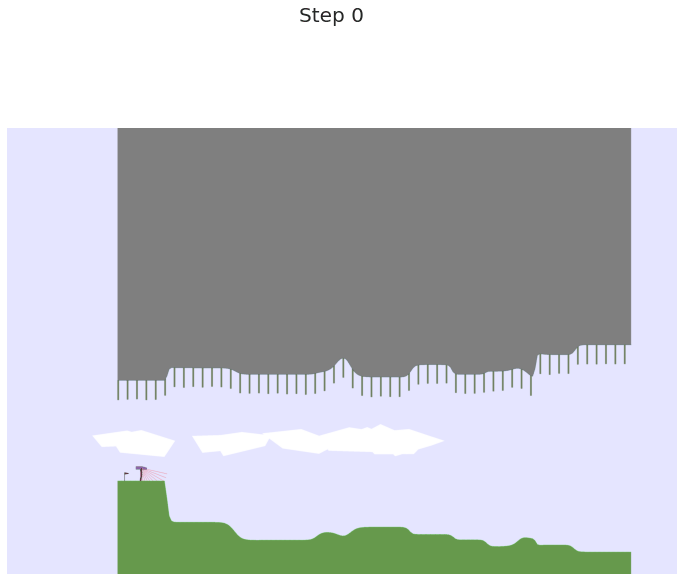
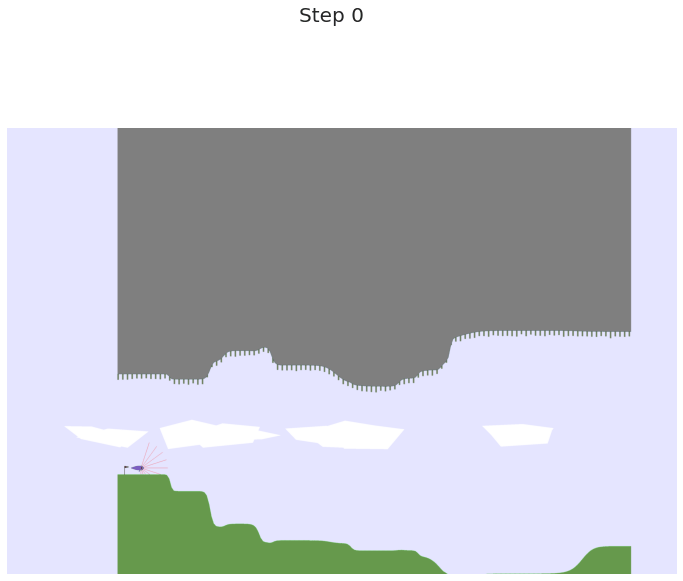
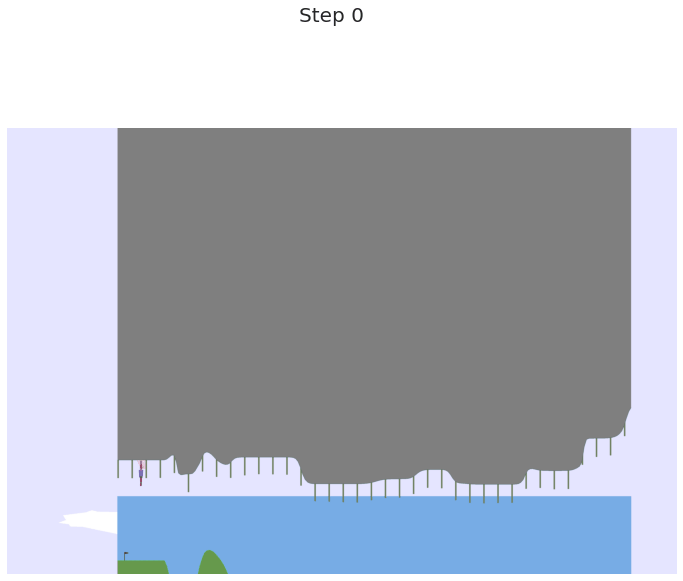
Then, for the Parkour, we plot, for the best seed of each morphology, a randomly chosen task among the 100 sampled.


Mostly unfeasible

Mostly unfeasible

Mostly feasible

Mostly feasible

Forgetting student

Forgetting student

Bipedal walker

Bipedal walker

Fish

Fish

Chimpanzee

Chimpanzee

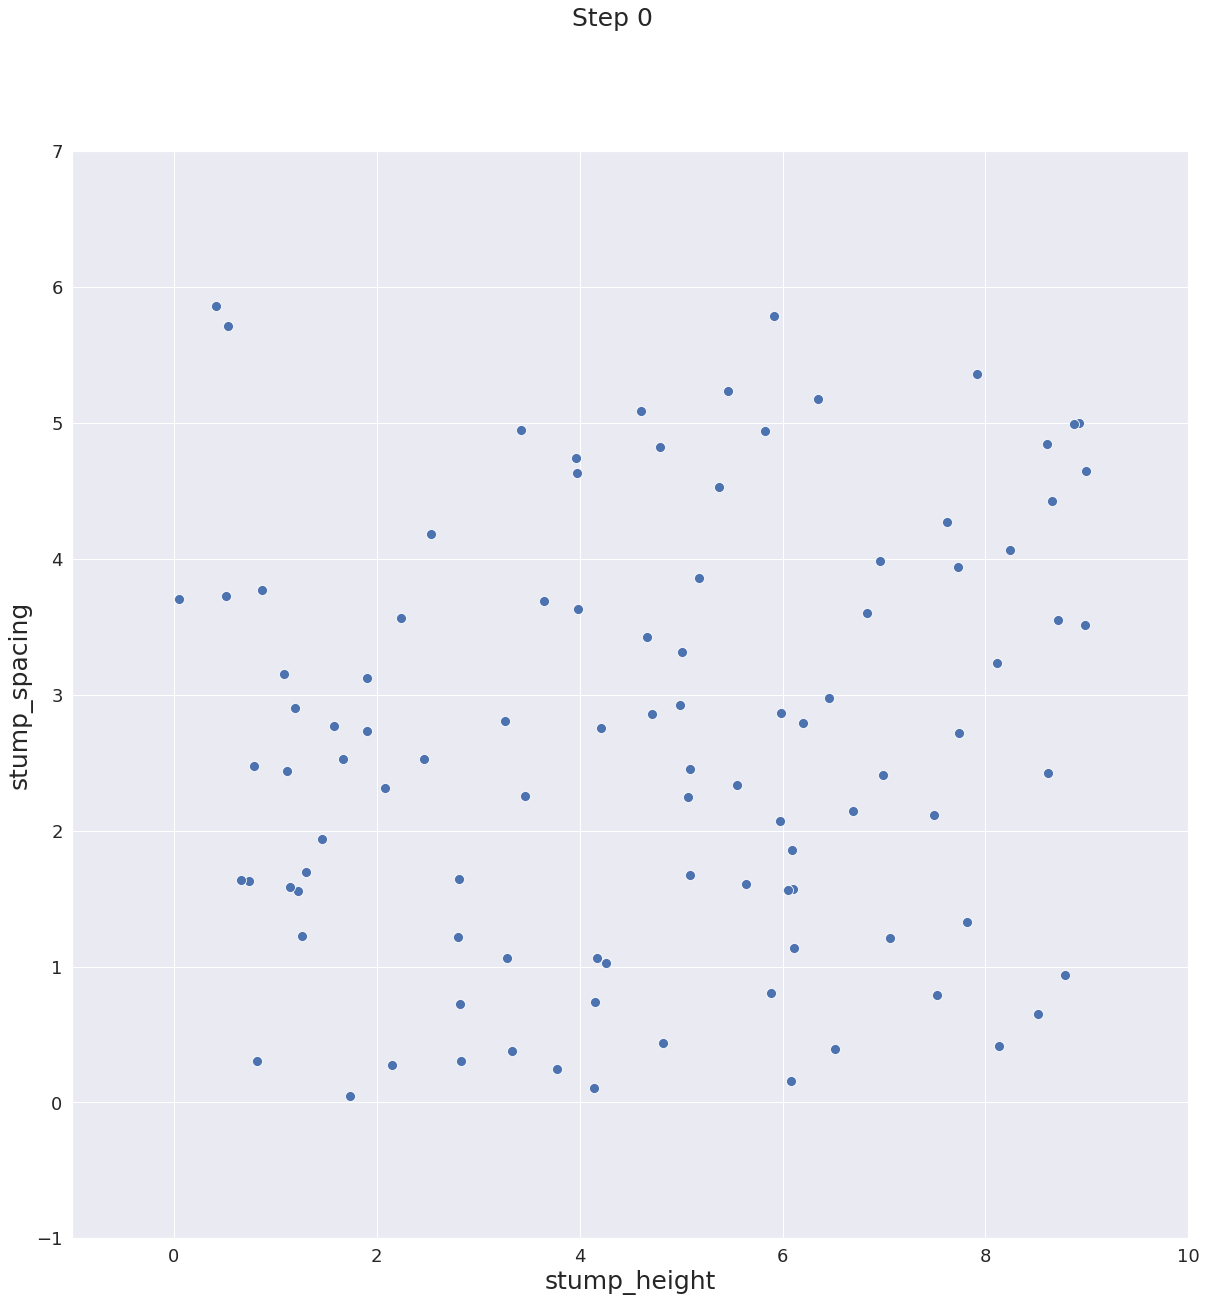
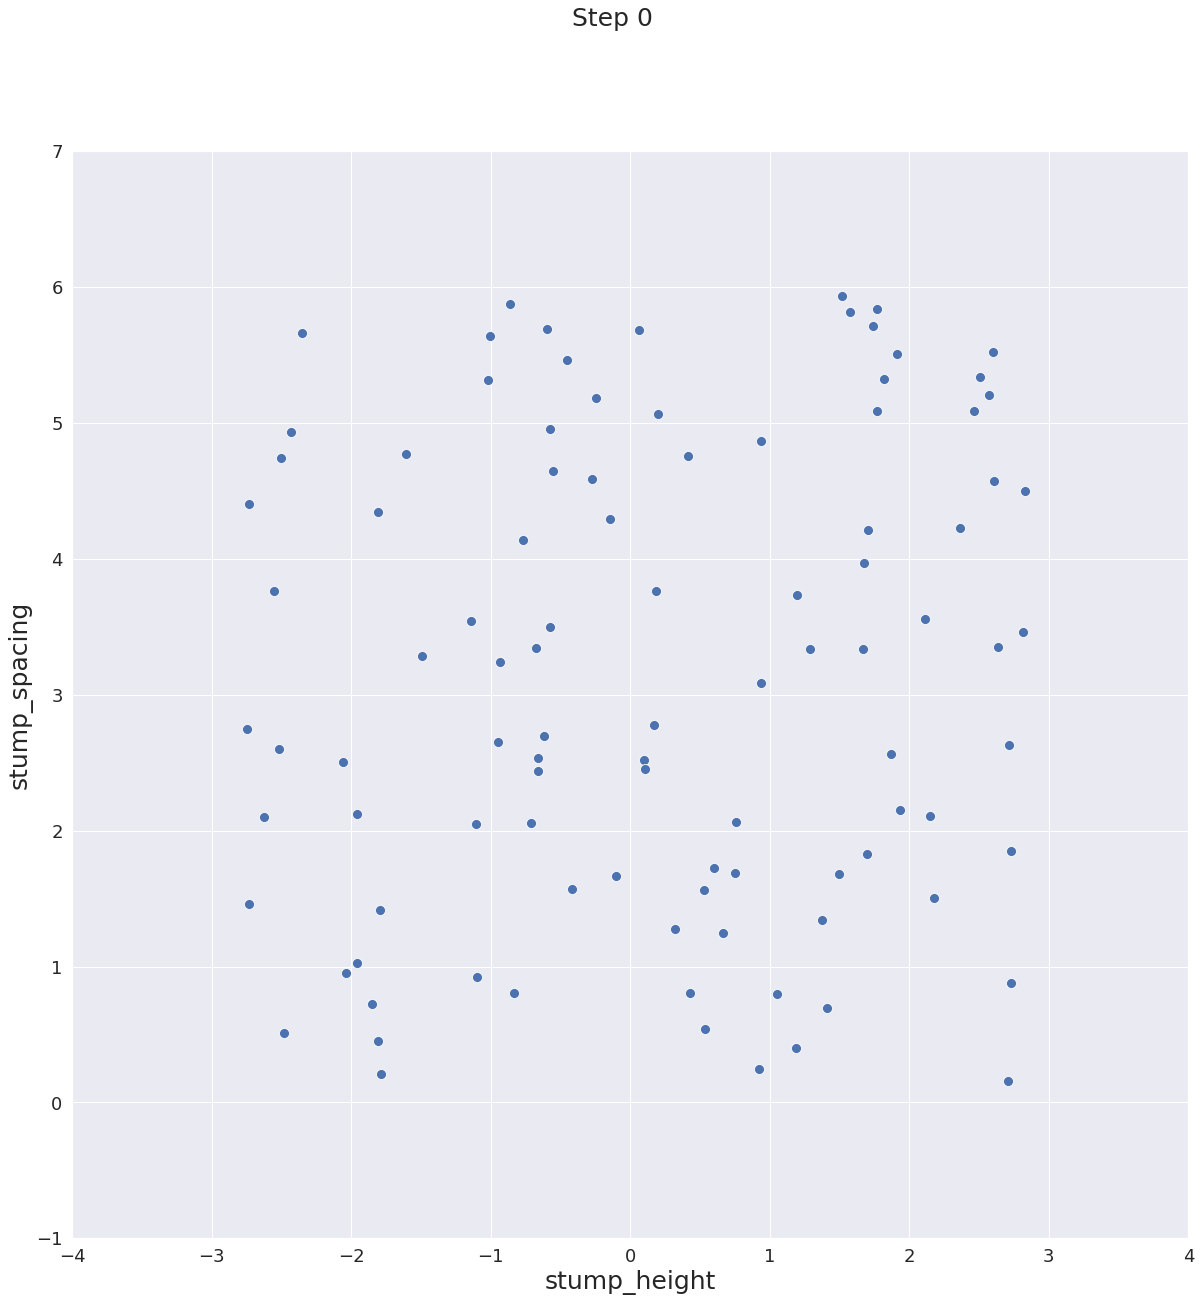
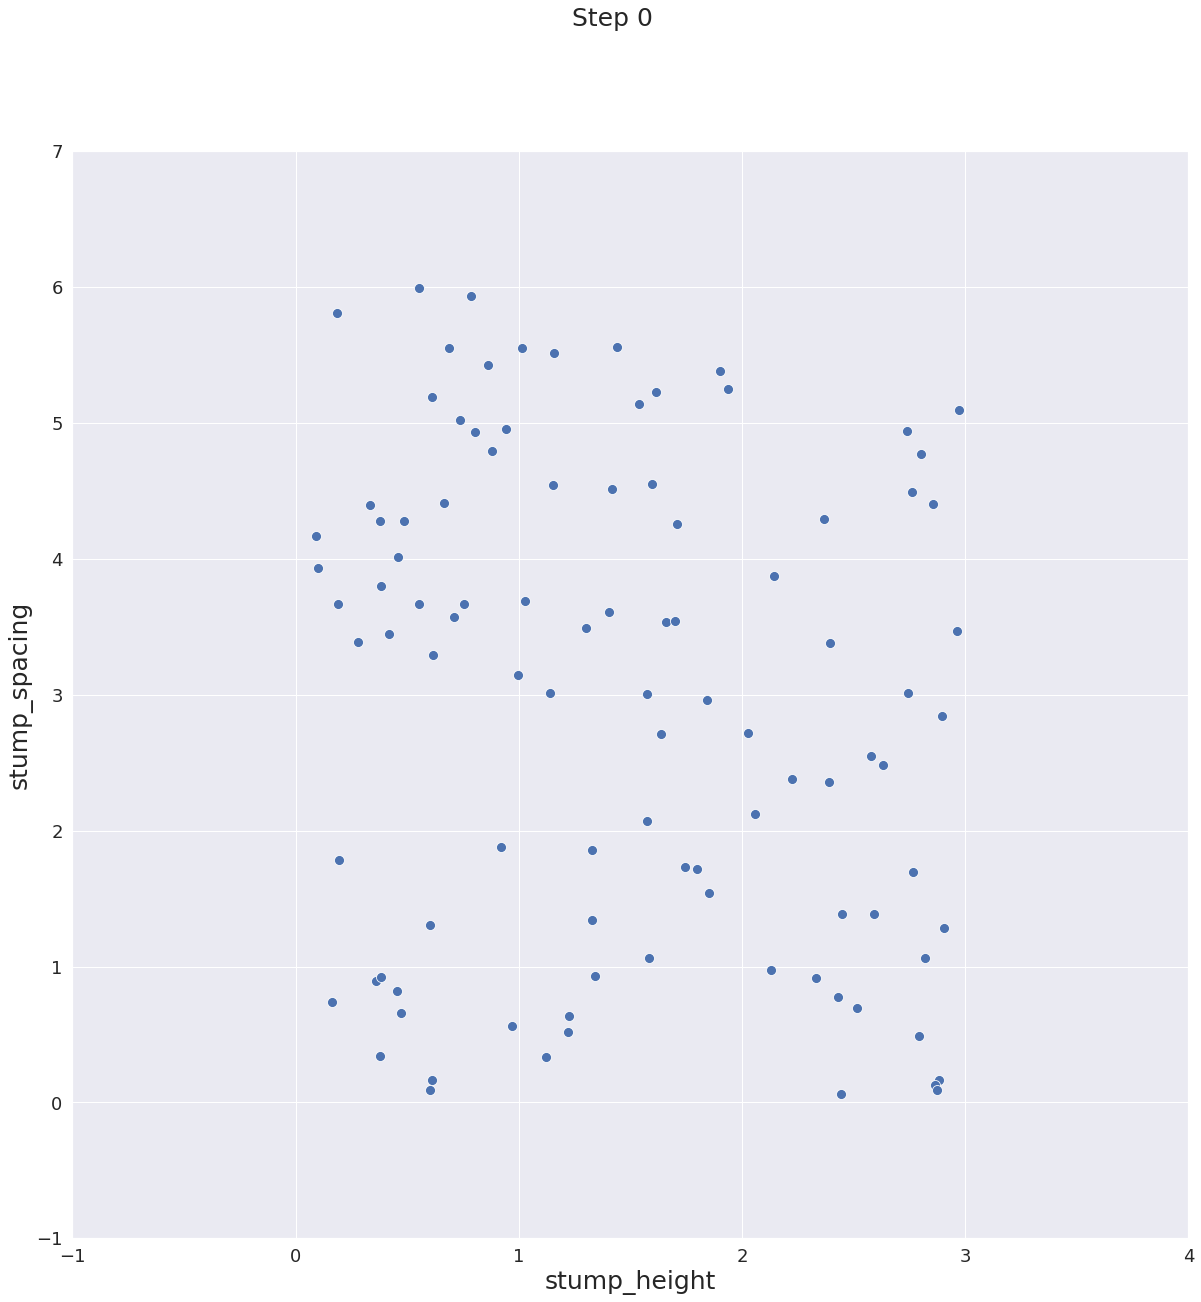
We plot in blue the uniform sampling distribution used to sample tasks.

Mostly unfeasible

Mostly unfeasible

Mostly feasible

Mostly feasible

Forgetting student

Forgetting student

Bipedal walker

Bipedal walker

Fish

Fish

Chimpanzee

Chimpanzee

We color each point using the Absolute Learning Progress of its region.

Mostly unfeasible

Mostly unfeasible

Mostly feasible

Mostly feasible

Forgetting student

Forgetting student

Bipedal walker

Bipedal walker

Fish

Fish

Chimpanzee

Chimpanzee

We show the Gaussian distributions colors with their mean Absolute Learning Progress.

Mostly unfeasible

Mostly unfeasible

Mostly feasible

Mostly feasible

Forgetting student

Forgetting student

Bipedal walker

Bipedal walker

Fish

Fish

Chimpanzee

Chimpanzee

We show the Gaussian distributions colors with their mean Absolute Learning Progress.

Mostly unfeasible

Mostly unfeasible

Mostly feasible

Mostly feasible

Forgetting student

Forgetting student

Bipedal walker

Bipedal walker

Fish

Fish

Chimpanzee

Chimpanzee

We plot in blue the Gaussian distribution of SPDL.

Mostly unfeasible

Mostly unfeasible

Mostly feasible

Mostly feasible

Forgetting student

Forgetting student

Bipedal walker

Bipedal walker

Fish

Fish

Chimpanzee

Chimpanzee

Mostly unfeasible

Mostly unfeasible

Mostly feasible

Mostly feasible

Forgetting student

Forgetting student

Bipedal walker

Bipedal walker

Fish

Fish

Chimpanzee

Chimpanzee

We color each point by its feasibility (uniformly sampled to generate the task).

Mostly unfeasible

Mostly unfeasible

Mostly feasible

Mostly feasible

Forgetting student

Forgetting student

Bipedal walker

Bipedal walker

Fish

Fish

Chimpanzee

Chimpanzee